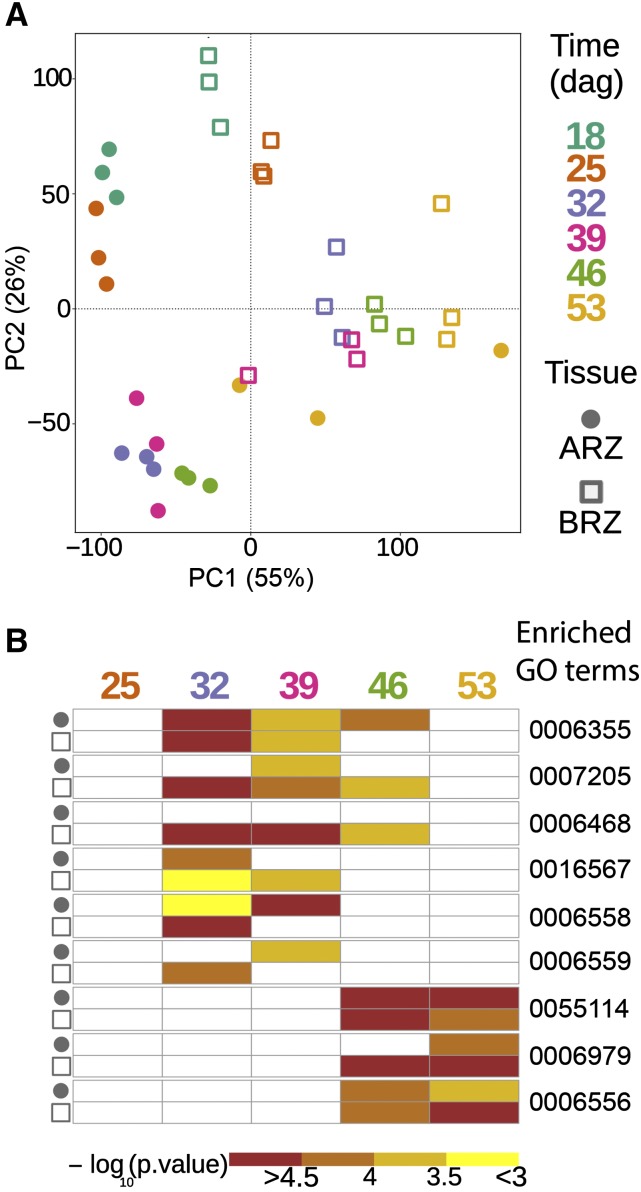
Figure 8.
Variation in transcriptomes and enrichment of gene ontology (GO) terms in genes expressed in the apical and basal root zone during seminal root aging. A, Principal component analysis (PCA) plot of 36 barley transcriptome datasets. B, Heat map of enriched GO terms in the apical and basal root zones (ARZ and BRZ, respectively) at each time point. Each data point in the PCA plot represents the transcriptome of either ARZ or BRZ samples at one of the six time points. ARZ tissues are marked with a circle and BRZ tissues with a square. Color corresponds to six different time points. In the GO term heat map, colors indicate −log10 transformed P values of each term. The complete list of enriched GO terms (Supplemental Tables S1–S5) was further filtered by two criteria to display the GO term heat map: (1) GO terms that are terminal nodes in the GO hierarchy in at least one time point of either ARZ or BRZ, and (2) the enriched GO term must be significant (P value < 0.05) in at least two out of 10 tissue-specific time points; dag, days after germination. GO:0006355, regulation of transcription, DNA-templated; GO:0007205, protein kinase C-activating G-protein coupled receptor signaling pathway; GO:0006468, protein phosphorylation; GO:0016567, protein ubiquitination. GO:0006558, l-Phe metabolic process; GO:0006559, l-Phe catabolic process; GO:0055114, oxidation-reduction process; GO:0006979, response to oxidative stress; GO:0006556, S-adenosyl-Met biosynthetic process. ARZ, Apical root zone; BRZ, basal root zone.

