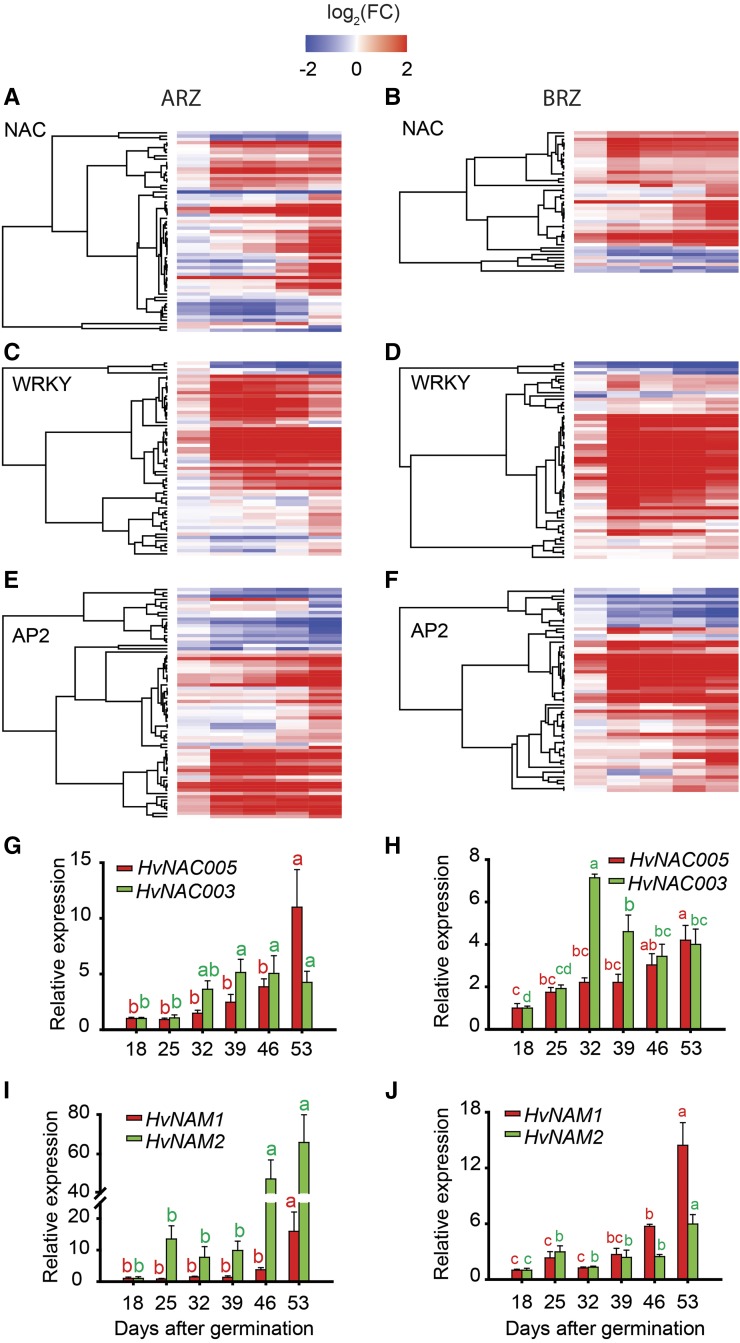
Figure 9.
Relative expression of NAC-, WRKY-, and AP2-type transcription factors with progressing plant age. Heat maps of NAC-type (A and B), WRKY-type (C and D), and AP2-type (E and F) transcription factors in apical and basal root zones (ARZ, BRZ, respectively) of plants sampled weekly from 18 to 53 d after germination (dag). G to J, Relative transcript levels of HvNAC003 (G and H) and HvNAC005, and HvNAM1 and HvNAM2 (I and J), as determined by quantitative PCR. For heat maps, transcript levels at 18 dag were taken as references for later time points, and relative differences were log2-transformed (log2FC) and displayed along a color scale. Relative expression values of target genes were normalized to transcript levels of UBIQUITIN C (AY220735.1), and values at 18 dag were set to 1. Bars represent means ± se. Different letters indicate significant differences among means according to Tukey’s test at P < 0.05 (n = 5 independent biological replicates).

