Figure 1.
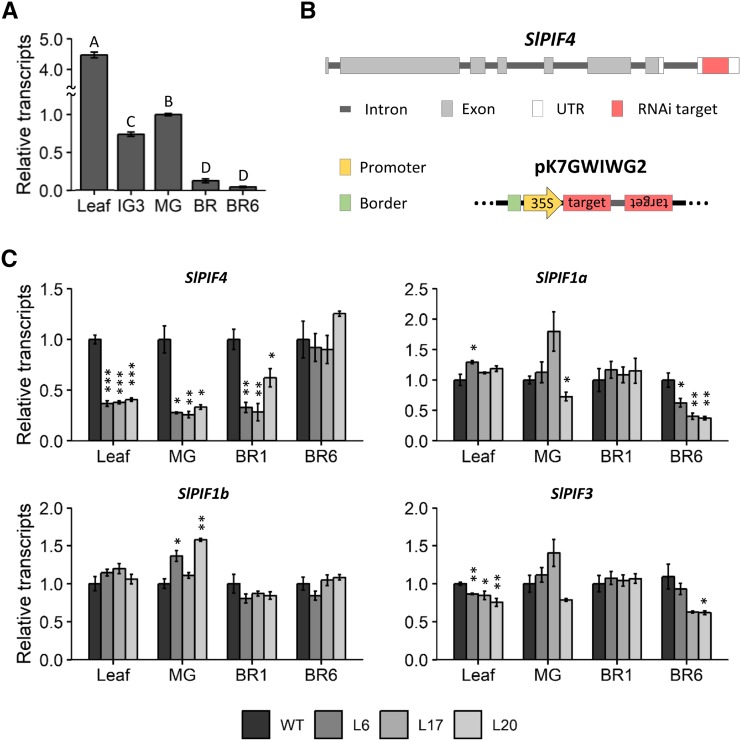
Expression profile of SlPIF4 in wild-type plants and SlPIF genes in SlPIF4-silenced plants. A, Transcript profile of SlPIF4 in wild-type (WT) plants. B, SlPIF4 gene structure showing the RNAi target sequence on the 3′ UTR in red. Also shown is the construct used for silencing in the pK7GWIWG2 vector. C, mRNA abundance of SlPIF genes in SlPIF4-silenced plants. Data shown are the mean ± se of at least three biological replicates (each composed of four fruits or two leaves) normalized against the mature-green (MG) stage (A) or the wild-type control (C). Significant differences between samples (A) and relative to the wild-type control (C) are denoted by uppercase letters (ANOVA followed by Fisher’s lsd test) and asterisks (two-tailed t test; *P < 0.05; **P < 0.01; ***P < 0.001), respectively. Leaf, the fourth leaf of 90 day-old plants; IG3, immature-green; BR, breaker stage; BR1, one day after BR stage; BR6: 6 days after BR stage; L6, 35S::SlPIF4-RNAi L6; L17, 35S::SlPIF4-RNAi L17; L20, 35S::SlPIF4-RNAi L20.

