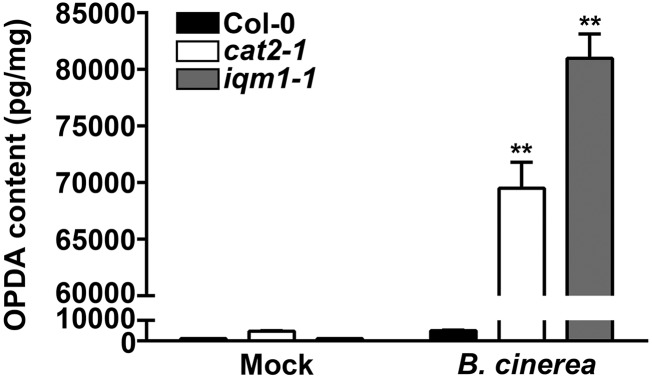
Figure 7.
Accumulation of OPDA in cat2 and iqm1 mutants. The OPDA levels of 4-week-old wild-type, cat2-1, and iqm1-1 mutant plants at 3 d after infection with B. cinerea are shown. The results were obtained from at least 30 independent plants for each genotype by mixed grinding. The data are means ± sd of three replicates. Asterisks represent significant differences compared with Col-0 (Student’s t test, **, P < 0.01).

