Figure 7.
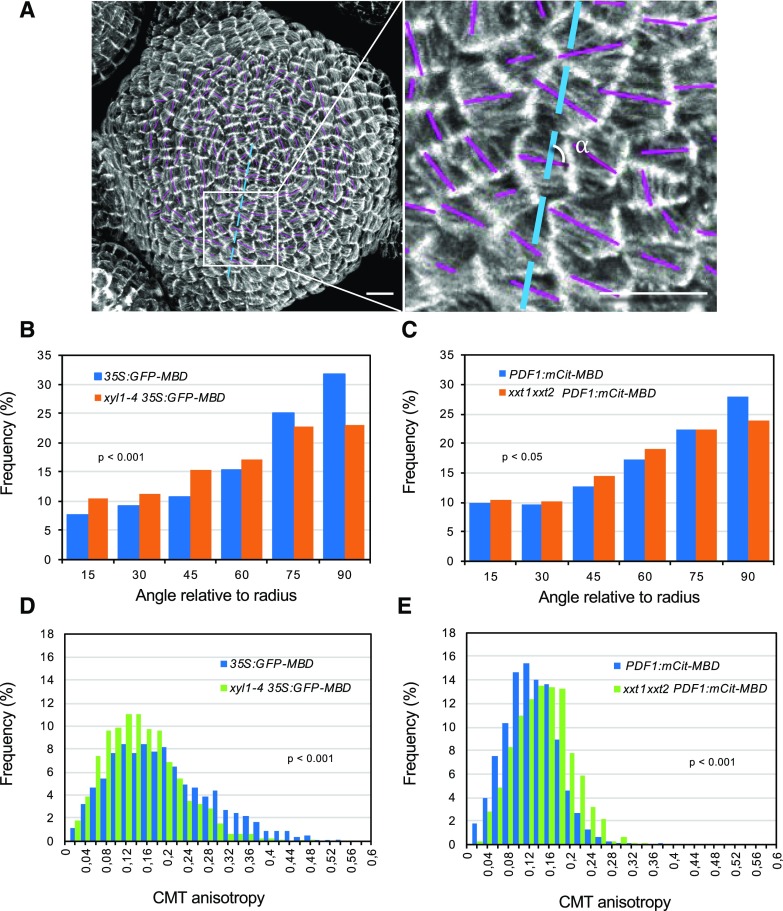
Microtubule patterning on wild-type and XyG mutant SAMs. A, Representative microtubule patterning on 35S:GFP-MBD SAM. The orientation and length of magenta bars represent average microtubule orientation and degree of anisotropy in a single cell, respectively. Blue lines represent the radius of meristem. Details are enlarged at right. The α indicates the angle relative to radius. Scale bars = 10 µm. B and C, Quantifications of CMT orientation relative to the radius of xyl1-4 (B) and xxt1xxt2 (C) SAMs. d and E, Quantifications of CMT anisotropy in xyl1-4 (D) and xxt1xxt2 € SAMs. Statistic data in (B–E) was calculated from n = 1345 cells of 5 meristems of 35S:GFP-MBD, n = 1522 cells of 5 meristems of xyl1-4 35S:GFP-MBD, n = 1203 cells of 5 meristems of PDF1:mCitrine-MBD, and n = 998 cells of 5 meristems of xxt1xxt2 PDF1:mCitrine-MBD. P-values are calculated based on Kolmogorov-Smirnov test in (B–E). See also Supplemental Figure S9 for more details of CMT organization.

