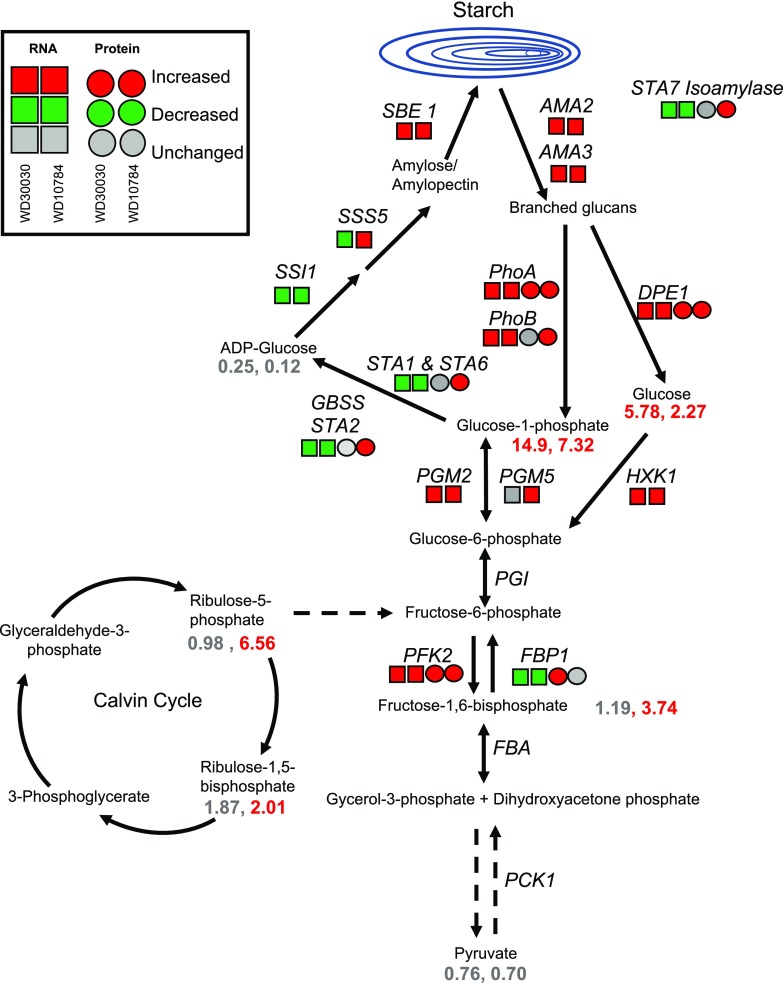
Figure 4.
Changes in transcript (squares) and protein (circles) levels for enzymes in the starch biosynthesis and degradation pathways after treatment with lipid-inducing compounds. Dashed arrows indicate multiple enzymatic steps. Fold change values of metabolite levels are given as numbers (see also Supplemental Datasets S1, S2, and S5). Enzyme abbrevations: SBE1, starch branching enzyme; SSS5, soluble starch synthase; STA1 and 6, glucose-1-phosphate adenylyltransferase; AMA2, 3, amylase DPE:disproportionating enzyme; HXK1, hexokinase; PGM2, 5, phosphoglucomutase; PFK1, phosphofructokinase; FBP1, fructose 1,6-bisphosphatase; FBA, fructose-bisphosphate aldolase; PCK1, phosphoenolpyruvate carboxykinase; PHOA, B, α-1,4 glucan phosphorylase

