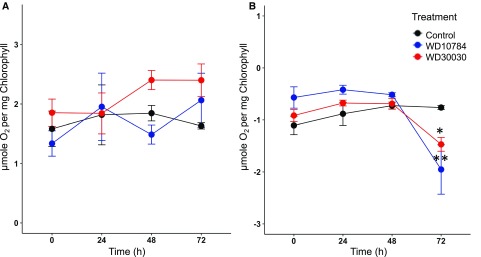
Figure 6.
Photosynthetic and respiratory rates during compound treatments. A, Photosynthetic rates of compound-treated cells measured at 24-h intervals for 72 h using a Clark oxygen electrode. Rates are expressed as O2 evolved per milligram of Chl (n = 3 biological replicates; ±sd). B, Respiratory rates were similarly determined by measuring oxygen consumption. Two way-ANOVA with Bonferroni posttest was applied to determine changes in experimental group over time (n = 3 ± sd). Statistically significant differences are indicated by *P ≤ 0.05, **P ≤ 0.01.

