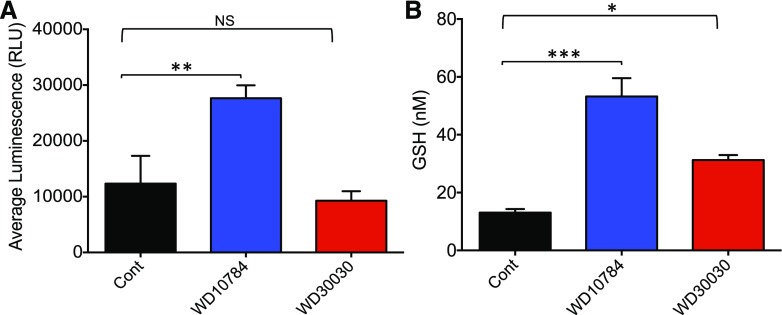
Figure 8.
Evaluation of redox stress after compound treatment. A, Levels of ROS estimated using an R-Glo H2O2 Assay Kit (Promega). B, Levels of reduced GSH assessed using the GSH-Glo Assay. Bar heights indicate the mean of three biological replicates, and error bars indicate the sd. Significance was determined by Student’s t test comparing the compound-treated samples with control samples within the same experiment. Statistical significance is indicated by NS, no significance; *P ≤ 0.05; **P ≤ 0.01; ***P ≤ 0.001. RLU, relative luminescence unit.

