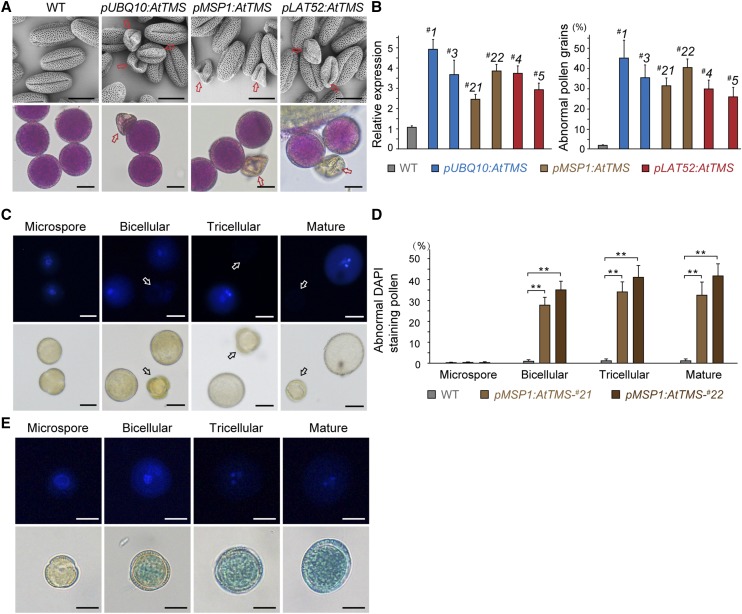
Figure 4.
AtTMS-OE impairs pollen development after the microspore stage. A, Scanning electron microscopy (top row) and Alexander staining (bottom row) micrographs of pollen grains from wild-type (WT) and AtTMS-OE plants using different promoters. The arrows indicate the shrunken and nonviable pollen grains. B, #1 and #3 of pUBQ10:AtTMS, #21 and #22 of pMSP1:AtTMS, and #4 and #5 of pLAT52:AtTMS transgenic lines were chosen randomly for analysis. Left graph, mRNA used for real time quantitative PCR (RT-qPCR) was extracted from flower buds. AtTMS expression relative to that of the wild type is shown for each line; right graph, n > 200 pollen was counted for each line. Values represent means ± sd of three independent experiments. C, pMSP1:AtTMS-#22 pollen was stained with DAPI and visualized under fluorescence (top row) and bright-field (bottom row) optics. Arrows indicate abnormal pollen. D, Quantification of abnormal DAPI-stained pollen. n > 200 pollen was counted for each line. Values represent means ± sd of three independent experiments. **, P < 0.001 by Student’s t test. E, AtTMS expression starts from the bicellular stage. GUS-stained pollen from pAtTMS:GUS plants in the bottom row was further stained with DAPI (top row) before observation. Bars = 10 µm in A, C, and E.

