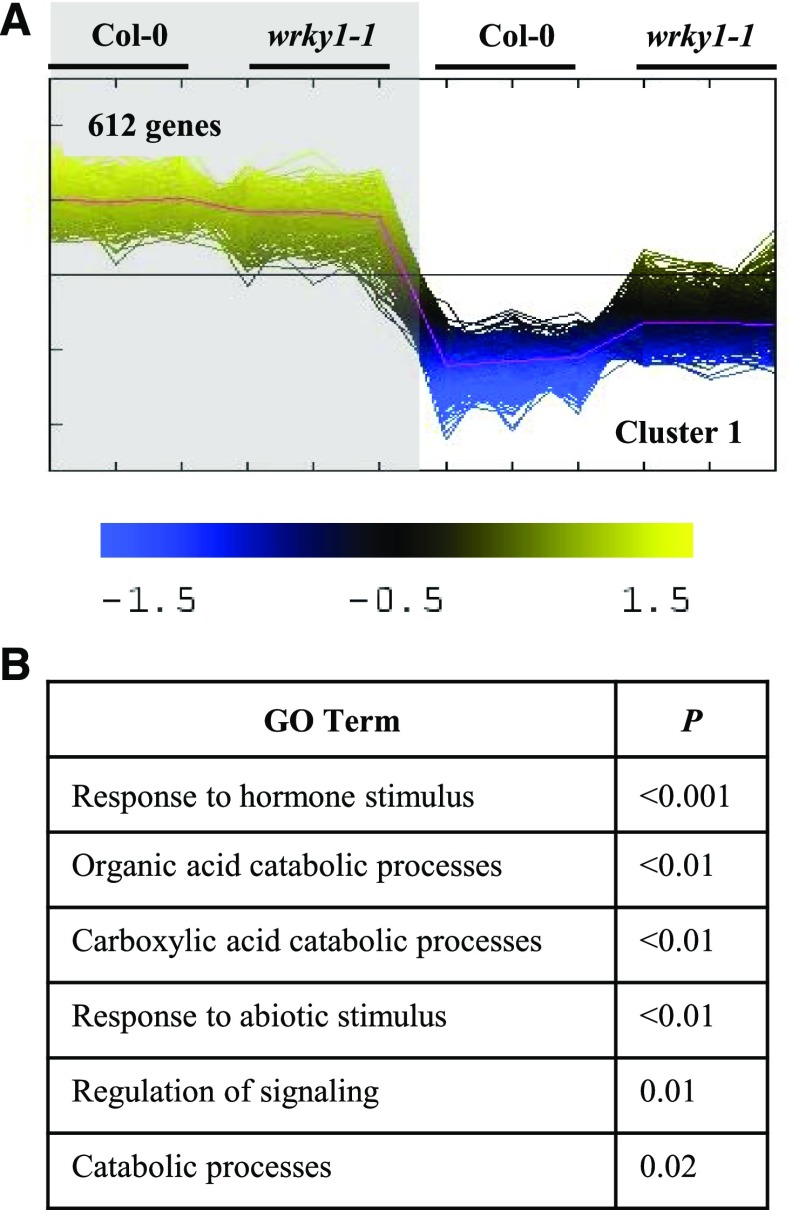
Figure 2.
Cluster analysis of WRKY1-dependent genes with significant G × light interaction reveals loss of light repression for some dark-inducible genes. A, Cluster analysis of genes with significant (P < 0.02, FDR 5%) G × light interaction effect (1,567 genes). The shaded area indicates dark conditions, and the nonshaded area indicates light conditions. Only cluster 1 is shown. The full cluster analysis can be viewed in Supplemental Fig. S5. B, GO-term analysis of gene cluster 1 with significant G × light effect.

