Figure 3.
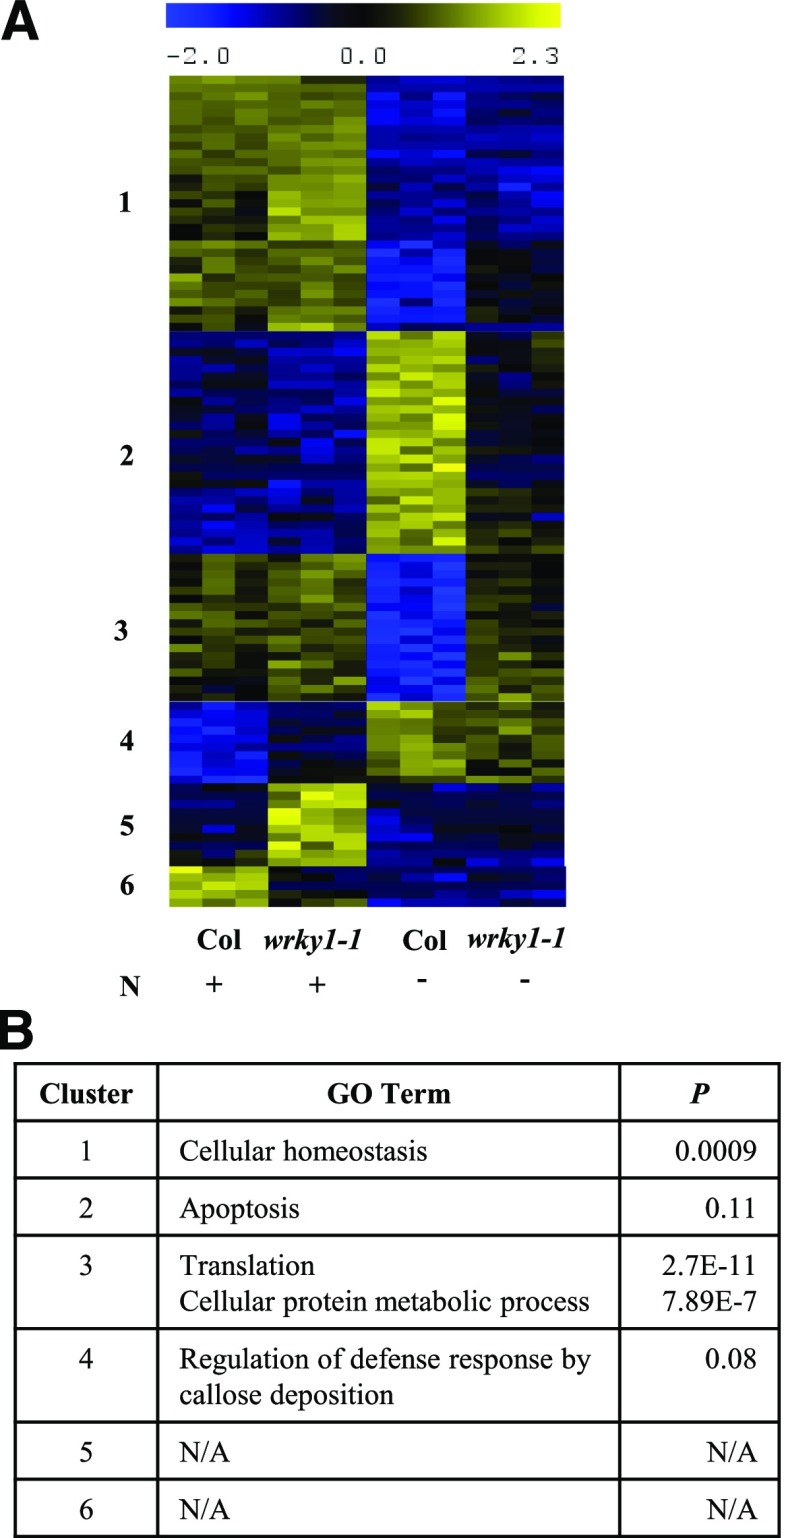
Cluster analysis of genes with significant N × G effect reveal that WRKY1 participates in plant response to N limitation. A, Cluster analysis of genes with significant (P < 0.02, FDR 5%) G × N interaction effect (123 genes). B, GO-term analysis of gene clusters with significant G × N effect.

