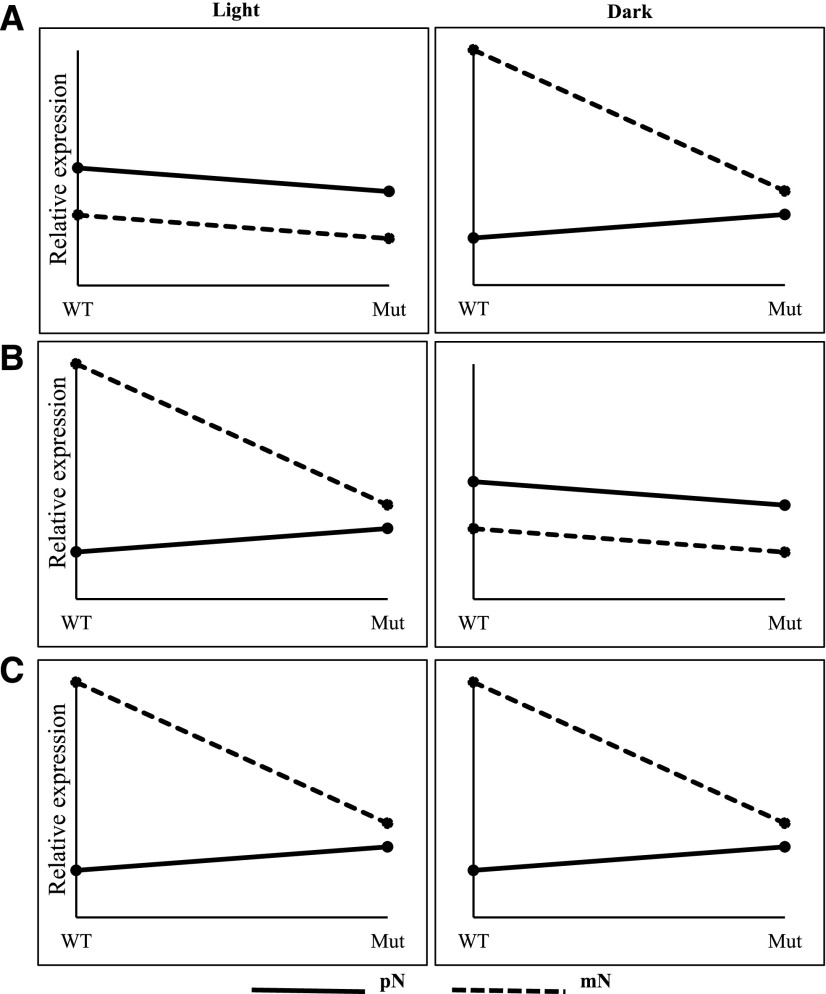
Figure 6.
Graphical representation of the sequential ANOVA to interpret the three-way interaction term. These plots represent the general observations for the 724 genes with significant three-way interaction. This example shows the three scenarios we observed for how gene expression changes in the light and the dark in response to the nitrogen variable across levels of the genotype variable. In our study, 78% of the genes only have a significant G × N interaction in the dark (A), 12% of the genes only have a significant G × N interaction in the light (B), and 10% of the genes have a significant G × N interaction in both dark and light conditions (C). mN, 20 mM KCl; Mut, wrky1-1; pN, 20 mM KNO3 + 20mM NH4NO3; WT, Col-0 wild type.

