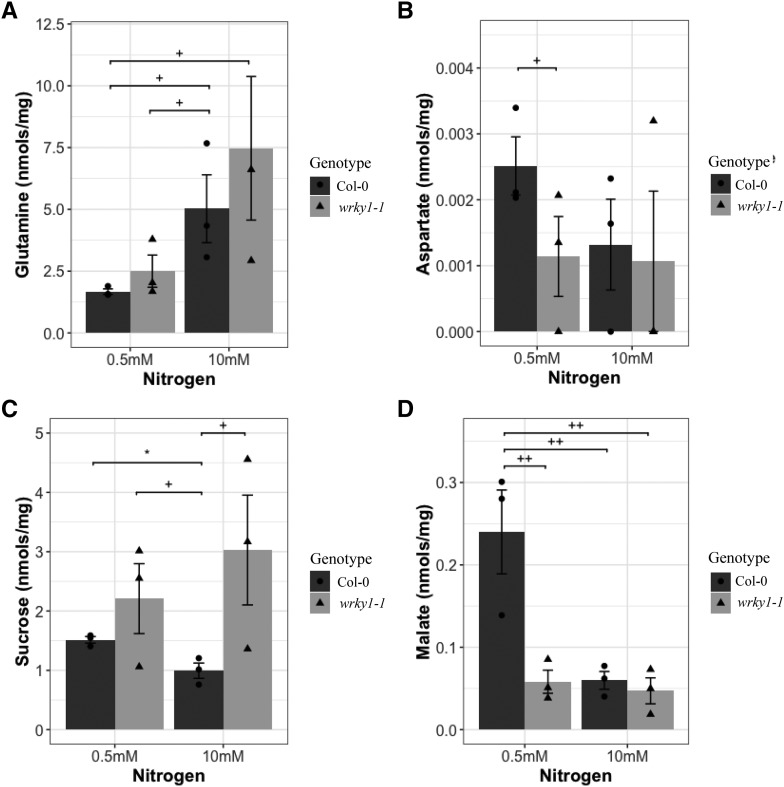
Figure 9.
Measured metabolite levels (mean ± sd [nmol/mg]) in Col-0 and wrky1-1. Metabolites Gln (A), Asp (B), Suc (C), and malate (D) were measured under nitrogen treatment of 0.5 mM KNO3− and 10.0 mM KNO3− (Student’s t-test; +P < 0.2, ++P < 0.1, * P < 0.05). Circles represent individual sample values G = Col-0; triangles represent individual sample values G = wrky1-1; n = 3.

