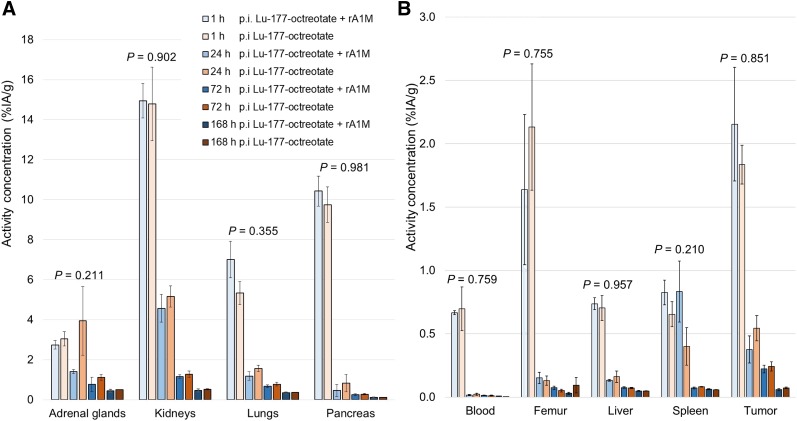
FIGURE 1.
Mean 177Lu activity concentration in adrenal glands, kidney, lungs, and pancreas (A) and in blood, femur, liver, spleen, and GOT2 tumors (B) at 1, 24, 72, and 168 h after injection (p.i.) with 177Lu-octreotate (5 MBq) or 177Lu-octreotate (5 MBq) and rA1M (5 mg/kg) (n = 4/group). Error bars show SEM, and P values show results from 2-way ANOVA of interaction of 2 groups over time. Note difference in y-axis scales.

