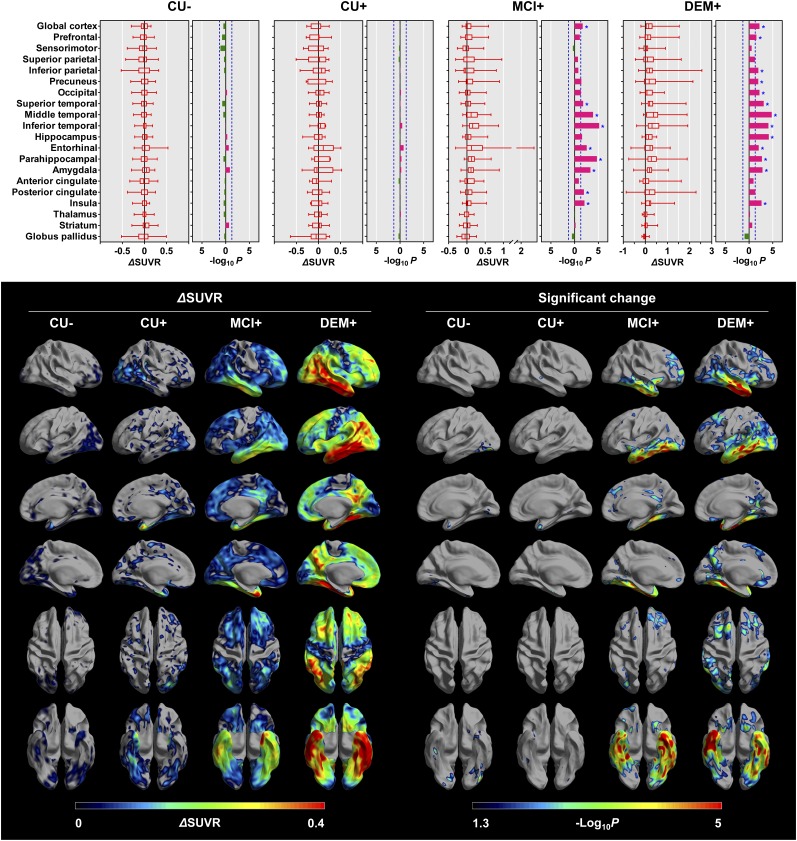
FIGURE 2.
Longitudinal changes in PVE-corrected 18F-flortaucipir SUVR obtained with cerebellar crus as reference region. Regional changes and their statistical significance are shown at top. Horizontal bars in leftward (green) and rightward (red) directions represent P values in log scale with decrease and increase of regional uptake at follow-up, respectively. Vertical blue dotted lines represent cutoff P value of 0.05 (−log10P = 1.3), and asterisks represent regions that survived correction for multiple comparisons. Surface-based analyses of longitudinal changes are shown at bottom. Mean increases in cortical 18F-flortaucipir SUVR (left) and cortical areas with significantly increased uptake at follow-up compared with those at baseline (right) are displayed on cortical surface. Only vertices that survived correction for multiple comparisons are displayed. For simplicity, negative changes are not displayed.

