. 2019 Jul 11;10(31):7333–7339. doi: 10.1039/c9sc02779c

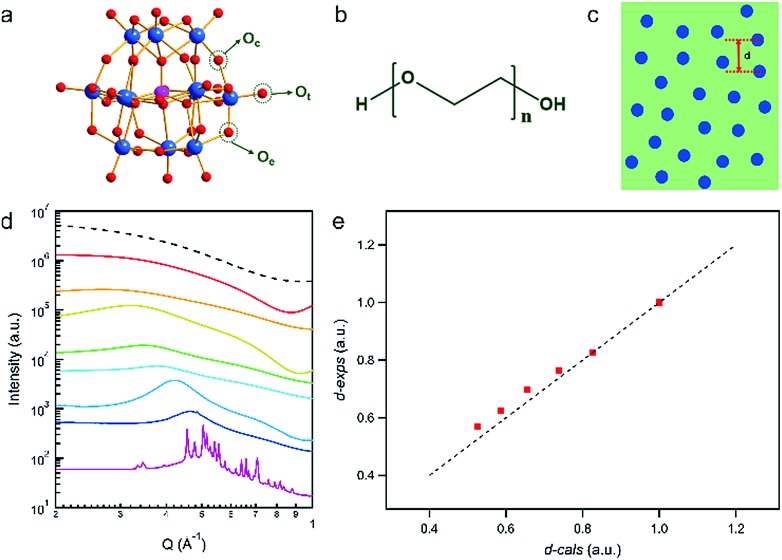
Fig. 1. (a) Ball-stick model of PW12. (b) Molecular formula for PEG400. (c) Schematic of the inter-cluster distance. (d) SAXS curves of the PEG400–PW12 nanocomposites with different PW12 concentrations (black dashed line for the form factor of PW12 simulated from the single crystal structure of PW12, red for PEG400–10% PW12, orange for PEG400–20% PW12, yellow for PEG400–30% PW12, green for PEG400–40% PW12, cyan for PEG400–50% PW12, light blue for PEG400–60% PW12, dark blue for PEG400–70% PW12, and purple for PEG400–80% PW12). (e) Relationship between d-exps and d-cals (red square for raw data and dashed line represents the fitted curve y = x).

Fig. 1