. 2019 Jul 15;10(34):8025–8034. doi: 10.1039/c9sc01032g

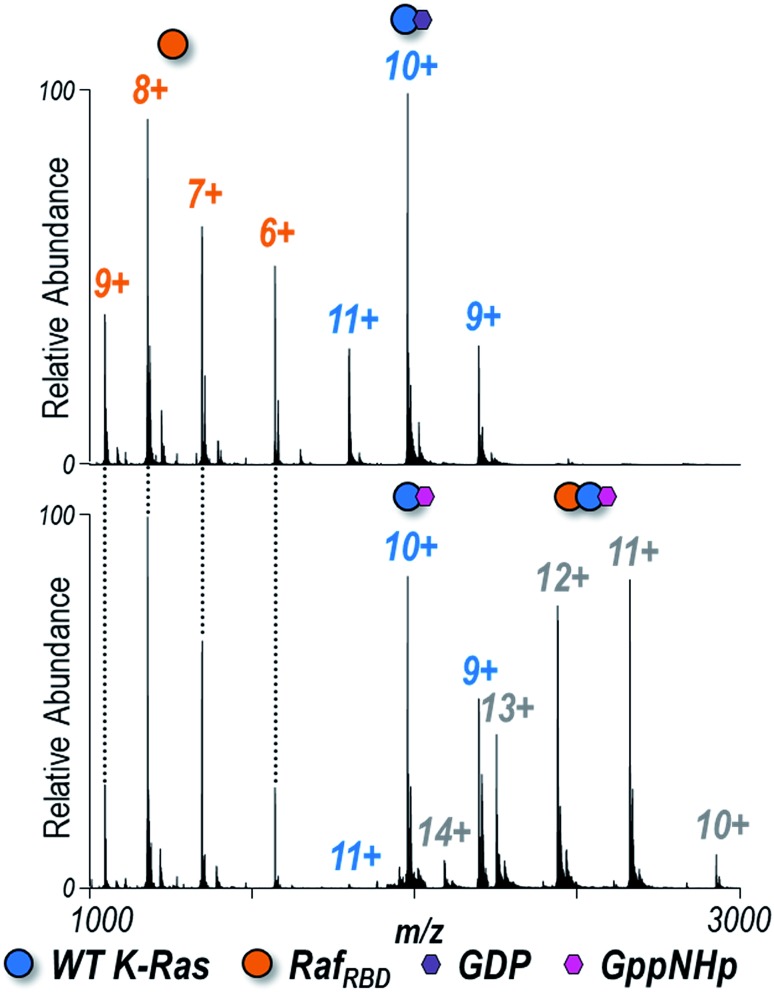
Fig. 2. Native ESI mass spectra of 1 : 1 K-Ras : RafRBD solution of WT K-Ras bound to (A) GDP or (B) GppNHp (1 : 1 ratio). Observed species are labelled as colored circles (6+, 7+, 8+, 9+ RafRBD monomers, 9+, 10+, 11+ K-Ras monomers, and 10+, 11+, 12+, 13+, 14+ heterodimers). Corresponding spectra for G12C, G12V, and G12S K-Ras are shown in Fig. S7. K-Ras:RafRBD heterodimers were only observed for solutions containing GppNHp (non-hydrolyzable analogue of GTP), not GDP. The relative abundances of each species are estimated from SEC-MS and reported in Fig. 3. The 12+ heterodimer was selectively isolated and activated to yield the UVPD spectra shown in Fig. S10. .

Fig. 2