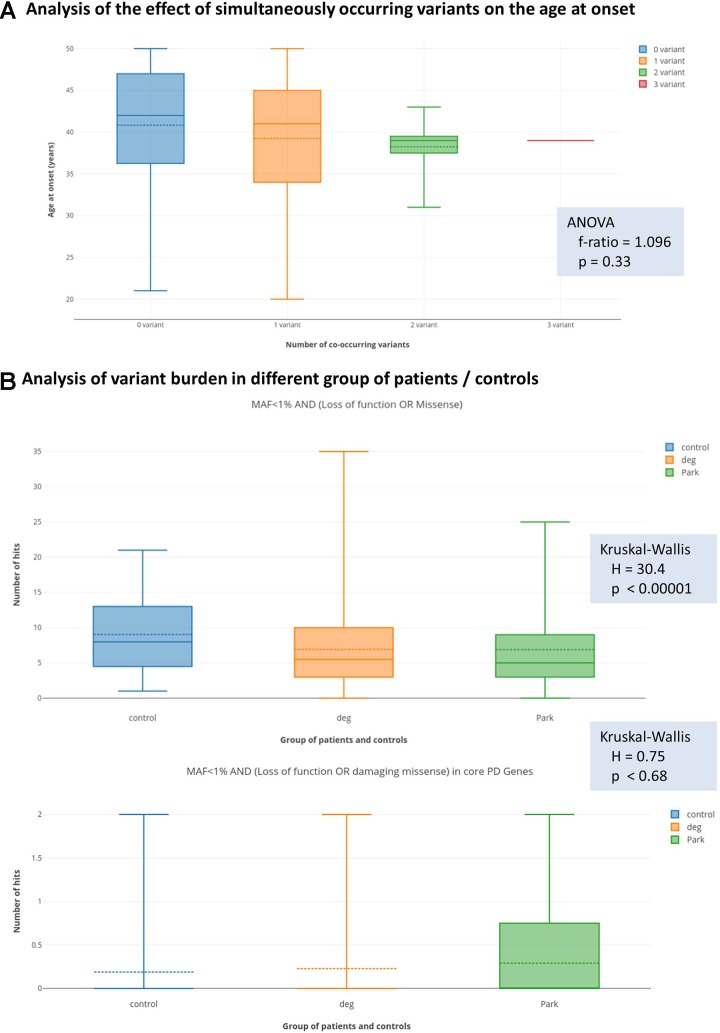
Figure 1.
Results of the analysis of oligogenic effects. Panel (A) shows the result of analysis coexisting variants (multiple-hits) on the age at onset. The box plots show the distribution of the age at the onset of symptoms if zero, one, two, or three simultaneous variants were present. Solid lines show medians and dashed lines the means. Differences between groups were not significant with ANOVA test. Panel (B) shows variant burden in the groups defined at the Methods section. Deg = patients with neurodegenerative diseases, without signs of Parkinsonism. Park = patients with Parkinsonism. We present the results with the least and most stringent filter criteria set. On the upper part of panel (B) (less stringent filters), we can see that more variants were present in the control group, which actually reached the level of statistical significance. On the lower part of panel (B) (most stringent applied filters), we can see that this difference diminished and even seemed to turn-around; however, in this case, the difference was not significant.

