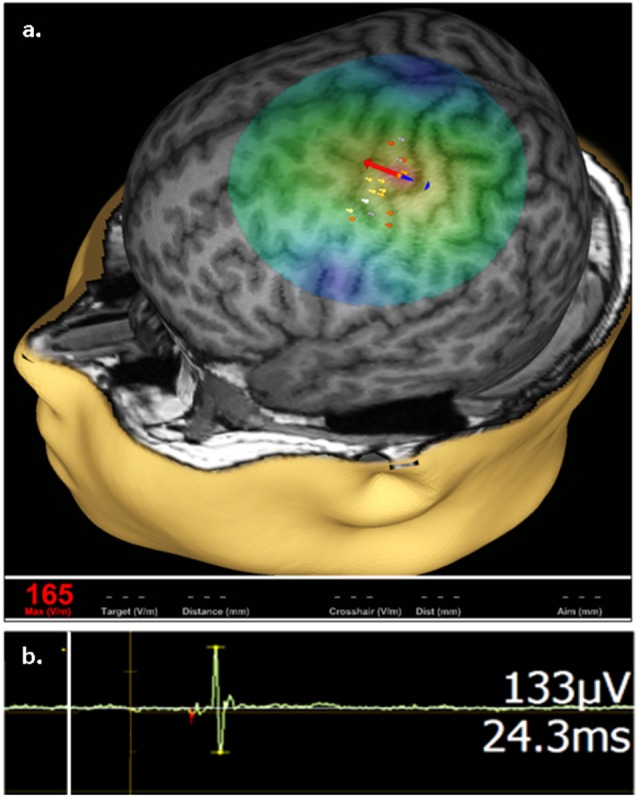
Figure 1.

Representative transcranial magnetic stimulation (TMS) motor cortex activation. (A) An approximation of stimulating electric field (e-field) induced by a single TMS pulse is displayed on a 3D reconstruction of an individual’s anatomic magnetic resonance imaging (MRI), where field center is indicated by the junction between the red and blue arrows, indicating the direction of induced current, with corresponding e-field strength at the stimulation site (V/m) shown in red in the bottom left. The composite map of left hemispheric stimulation sites evoking motor evoked potentials (MEPs) of the right abductor pollicis brevis (APB) muscle, where intensity of response is color coded (heat map) from lowest (gray) to highest (white), are displayed on the cortical surface rendering. (B) Representative right APB MEP sample (green deflection) showing right APB resultant from left hemisphere stimulation, where the vertical line (white) corresponds to stimulus time. MEP amplitude and latency are indicated on the right.
