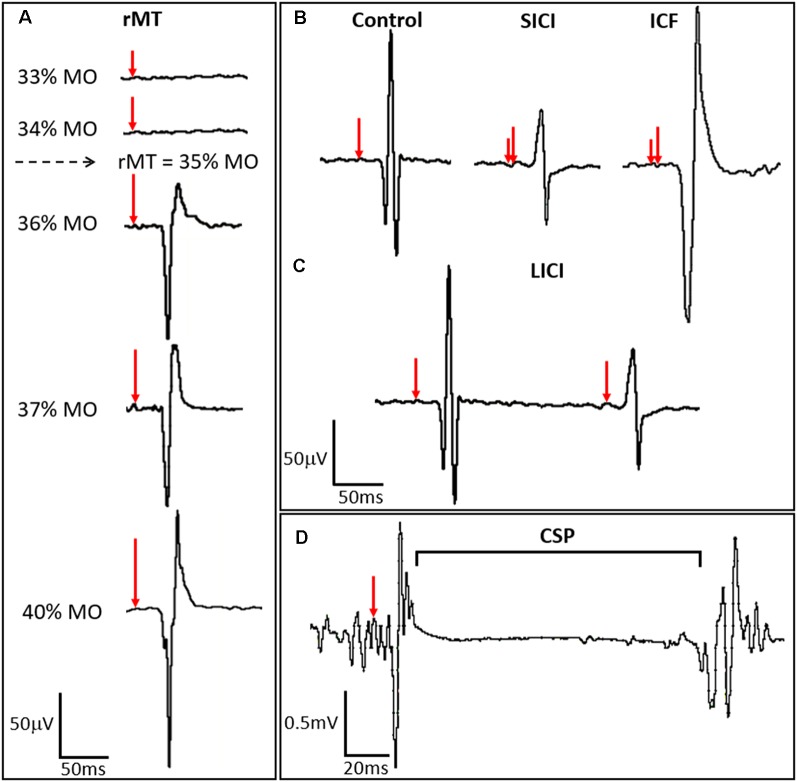
Figure 2.
TMS-derived metrics of motor cortex excitation and inhibition. (A) Resting motor threshold (rMT) for the APB muscle is calculated by identifying the minimum stimulus strength, measured in percent machine output (% MO), that evokes an MEP of a fixed amplitude (typically ≥50 μV) in the APB at rest in a majority of trials. Stimulus strength is indicated in the left panel, with resulting MEPs shown in the right panel, where red arrows indicate the time of stimulation and percent stimulator output is proportionate to the arrow length. (B) ppTMS paradigms where a subthreshold conditioning stimulus (short red vertical line) followed by a supra-threshold test stimulus (longer red vertical line). At short inter-stimulus-intervals (ISIs) (1–5 ms) short interval intracortical inhibition (SICI) is seen with inhibition of the test MEP by the antecedent conditioning stimulus. At longer ISIs (10–20 ms), test MEP amplitude is enhanced relative to the control MEP, such that ICF is seen. (C) Still longer ISIs (50–300 ms) are applied with two suprathreshold stimuli in LICI protocols where the MEP resultant from the test stimulus is predictably lower in amplitude than the preceding MEP resulting from the conditioning stimulus. In (D) the cortical silent period (CSP), interruption of ongoing electromyography (EMG) activity for a voluntarily contracting target muscle, occurs following single-pulse TMS (spTMS).

