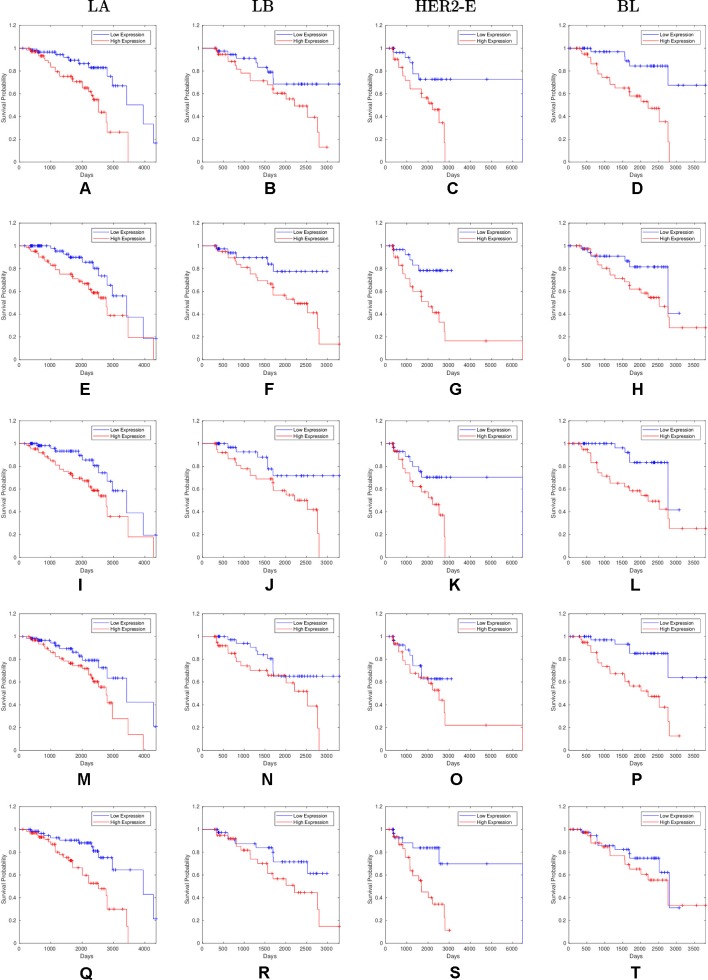
Figure 3.
Survival plots of top five four-star miRNAs: (A–D):hsa-miR-365a-3p, (E–H):hsa-miR-452-5p, (I–L):hsa-miR-378a-3p, (M–P):hsa-miR-215-5p and (Q–T):hsa-miR-103a-3p as mentioned in Table 2 where blue line indicates low expression group and red line indicates high expression group.

