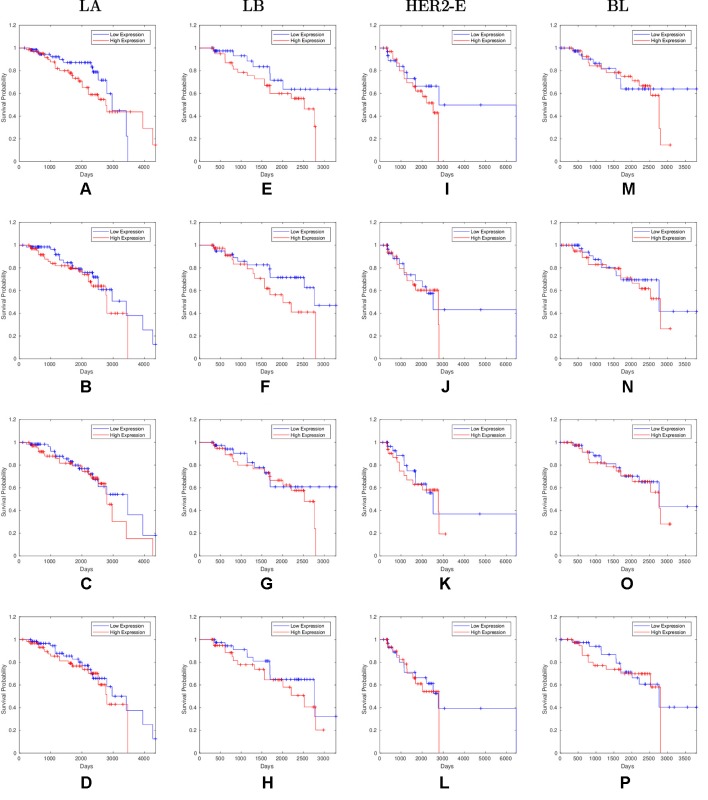
Figure 4.
Survival plots of top four one-star miRNAs for LA:(A) hsa-miR-30b-3p (B) hsa-miR-1247-5p (C) hsa-miR-221-3p (D) hsa-miR-186-5p LB:(E) hsa-miR-485-3p (F) hsa-miR-582-3p (G) hsa-miR-491-5p (H) hsa-miR-22-5p HER2-E:(I) hsa-miR-30c-5p (J) hsa-miR-26b-3p (K) hsa-miR-29c-5p (L) hsa-miR-19b-3p BL:(M) hsa-miR-199b-5p (N) hsa-miR-889-3p (O) hsa-miR-26b-5p (P) hsa-miR-214-3p subtypes as mentioned in Table 3 where blue line indicates low expression group and red line indicates high expression group.

