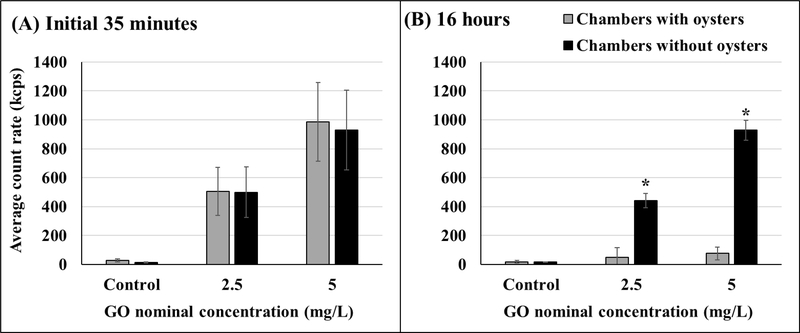
Figure 3.
Average particle count rate in chambers with and without oysters within the initial 35 minutes of GO addition (A) and 16 hours after GO addition (B). Asterisks represent significant differences between chambers with and without oysters. Initial 35 minutes: n = 10 for chambers with oysters, n = 5 for chambers without oysters; 16 hours: n = 8 for chambers with oysters, n = 4 for chambers without oysters. Values represent means and standard deviations.

