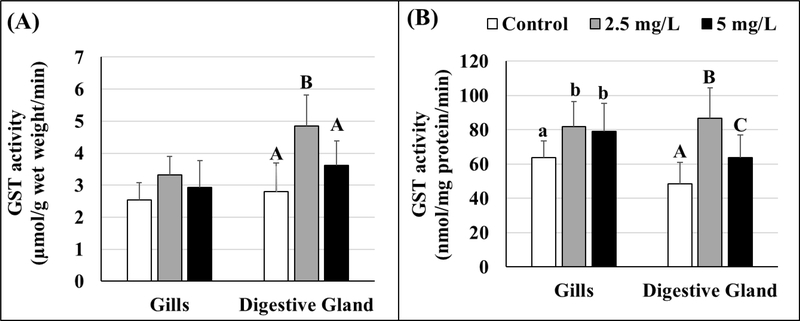
Figure 6.
Activity of glutathione-s-transferase (GST) in gill and digestive gland tissues of control and GO-exposed oysters expressed as per gram wet tissue (A) and standardized per mg protein (B). Lowercase letters represent differences in gills and uppercase letters represent differences in digestive gland tissues of control and GO-exposed oysters. Different letters indicate significant differences between concentrations, no letters represent no differences, n = 8 per treatment. Values represent means and standard deviations.

