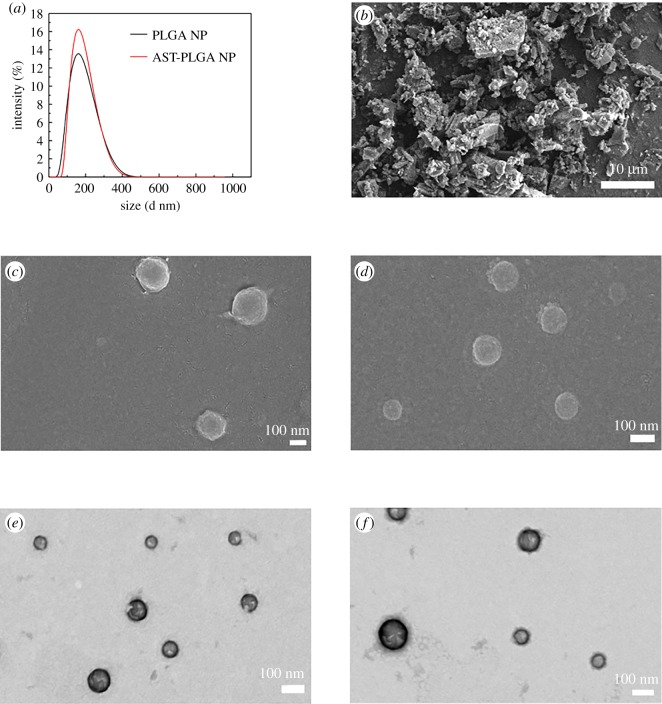
Figure 2.
(a) The particle size distribution of PLGA NP and AST-PLGA NP. Scanning electron microscopic (SEM) images of (b) astaxanthin (AST), scale bar, 10 µm; (c) blank PLGA nanoparticles (PLGA NP); and (d) astaxanthin-loaded PLGA nanoparticles (AST-PLGA NP). Transmission electron microscopy (TEM) images of (e) PLGA NP, and (f) AST-PLGA NP, scale bar, 100 nm.

