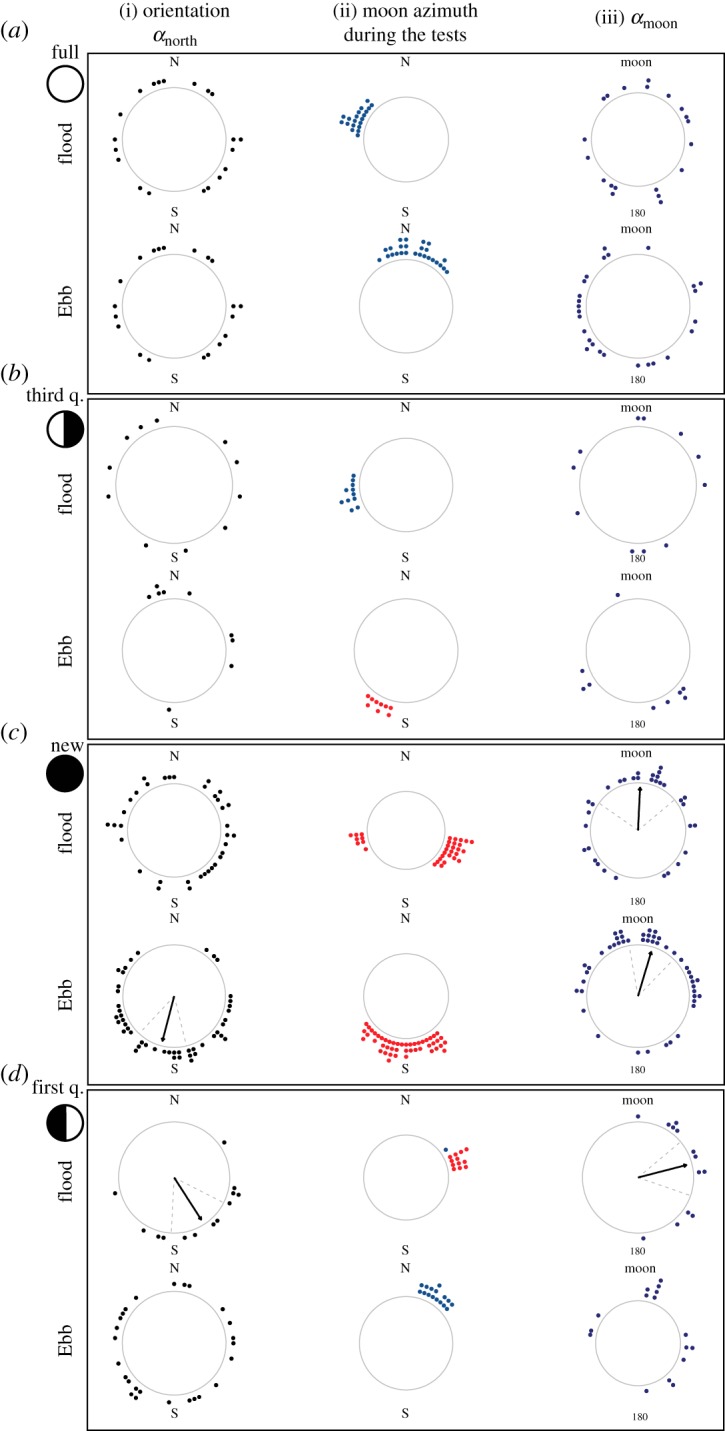
Figure 4.

Orientation of glass eels (Anguilla anguilla) at sea and moon-related orientation. Orientation of the glass eels, the azimuth of the moon and orientation with respect to the azimuth of the moon (as described in figure 3), during each of the four main moon phases [(a): full moon, (b): third quarter, (c): new moon, (d): first quarter] and during each tidal phase (flood/ebb). The frame of reference of each plot is indicated: N = magnetic north, MOON = direction of the moon at the horizon (azimuth). In the first and third column, significant preferences of orientation direction are shown by a black arrow starting from the centre of the circle and pointing towards the mean orientation direction. Dashed grey lines are the 95% confidence intervals around the mean. The circular plots are empty when there was no significant preference of orientation direction. The first column i. Orientation (αnorth) shows the orientation of glass eels with respect to the magnetic north (0°) and south. Each black data point represents the mean bearing of a single glass eel. Only the glass eels that had a significant individual orientation are presented. The second column, ii. Moon azimuth during the tests, shows the direction of the moon azimuth during each DISC deployment. The points are blue if the moon was below the horizon and red if the moon was above the horizon. The third column, iii. (αmoon), shows how far the glass eels were orienting from the moon azimuth (MOON, top of the plot = 0°). The angular difference between the orientation of each eel and the azimuth of the moon is shown as a navy-blue data point. Significant collective orientation towards the direction of the moon is shown as a black arrow pointing towards the top of the plot (at new moon and first quarter).
