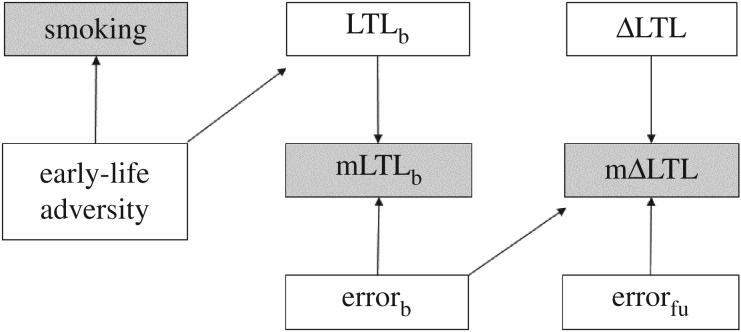
Figure 1.
Directed acyclic graph summarizing the assumed causal relations between smoking, mLTLb and mΔLTL. The graph additionally includes the following unmeasured/latent variables: exposure to early-life adversity, true LTLb, baseline measurement error (errorb), true telomere change (ΔLTL) and follow-up measurement error (errorfu). Errorb and errorfu are uncorrelated and independent of LTL and ΔLTL. Causal relationships are indicated by arrows. This diagram is analogous to that presented in Glymour et al. ([31]; their fig. 3) and Glymour & Greenland ([30]; their figs 12–14) and can thus be subjected to an identical analysis. See text for further details.

