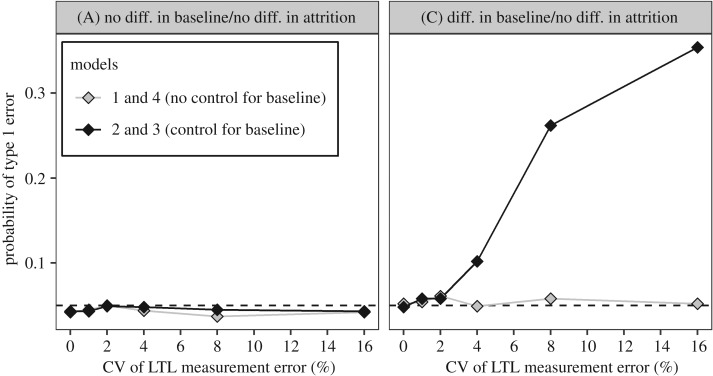
Figure 3.
Controlling for LTLb increases the probability of false-positive errors when there is a difference in LTLb. Probability of a type 1 error as a function of measurement error (CV) for the four models under consideration. Data points represent the proportion of simulations yielding a p-value below 0.05 in 1000 replicate simulations. The left and right panels show the probability of type 1 errors in scenarios A and C, respectively. The difference in LTLb between smokers and non-smokers in scenario C was LTLb 141 bp shorter in smokers.

