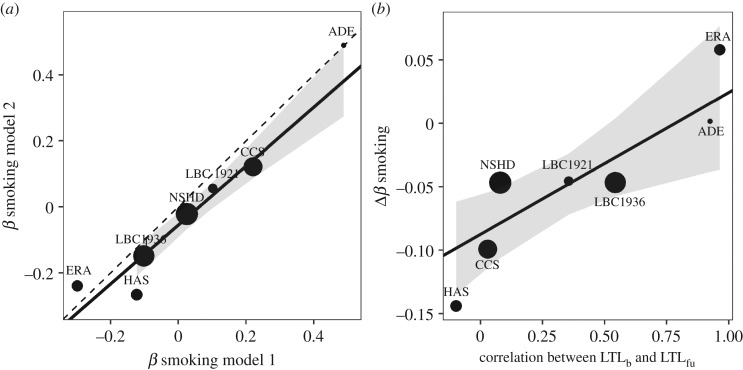
Figure 6.
The biasing effect of controlling for LTLb. (a) The relationship between the β coefficients for smoking derived from models 1 (no control for LTLb) and 2 (control for LTLb). The dotted line shows the expectation if the coefficients were identical. (b) The correlation between a signature of LTL measurement error (the correlation between LTLb and LTLfu; larger values indicate lower measurement error) and the difference between the β coefficients derived from models 1 and 2. In both panels, the solid black line was derived from a linear regression in which the points were weighted by the number of participants in each cohort and the grey ribbon shows the 95% confidence interval for this line.

