Figure 5.
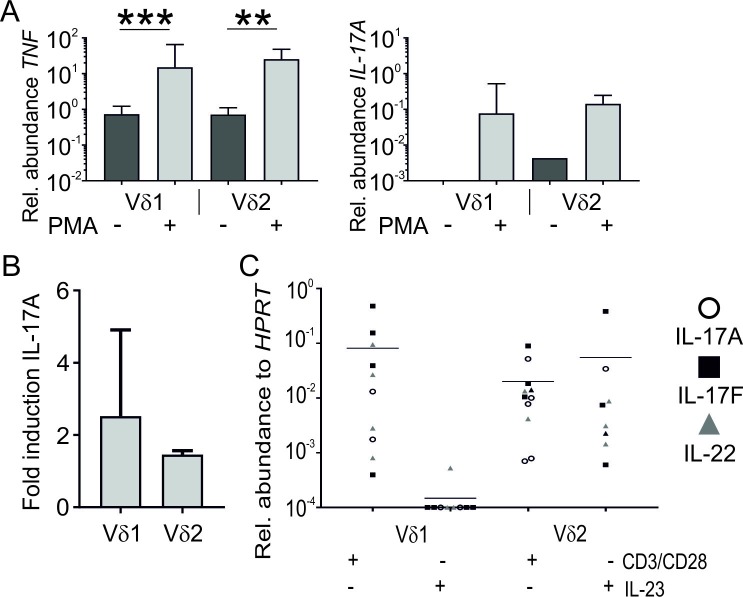
TNFα and IL-17A are produced by both γδT-cell subsets quantitative PCR showing TNFα and IL-17A transcript expression in γδT-cell subsets with or without stimulation (n=8) (A). Fold induction of secreted IL-17A protein following PMA/ionomycin stimulation compared with unstimulated fraction of purified Vδ1 and Vδ2 subsets (n=3) bar shows that mean whiskers represent 1 SD (B). Transcript expression of IL-17A, IL-17F and IL-22 following 48-hour stimulation of Vδ1 and Vδ2 subsets with combined anti-CD3/CD28 or IL-23 stimulation (n=10). Line denotes mean expression (all genes combined) (C). Genes for which a housekeeping value was obtained, but for which a target value was not, were assigned a value of 0.0001, as 0 cannot be plotted on a log scale. *P<0.05, **P<0.01, ***P≤0.001.

