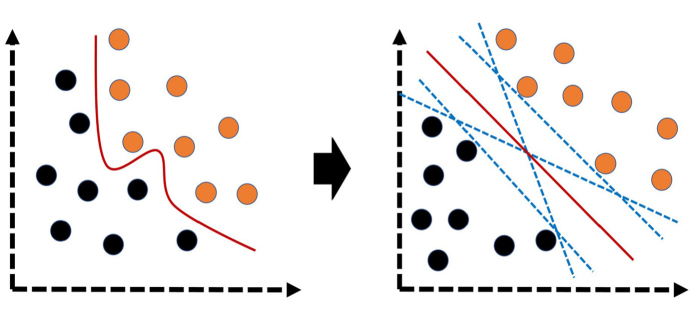
Figure 8.
Over-simplified illustrations of support vector machine. In simple terms, this algorithm transforms the original data (left illustration) to a different space (right illustration) to develop optimal plane or vector (red line) that separates the classes. Black and orange circles represent different classes.

