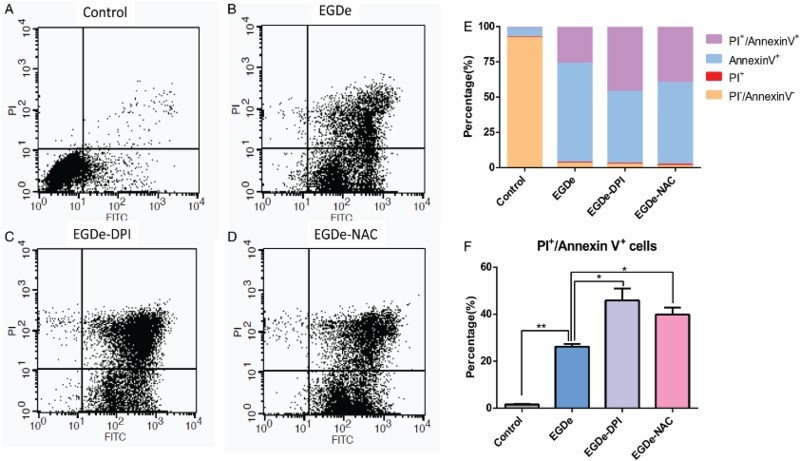
Figure 3.

Apoptosis ratio of glial cells increased upon invasion by DPI- and NAC-treated L. monocytogenes. (A) Flow cytometry data of U251 cells without L. monocytogenes invasion. X-axis refers to the annexin V-FITC, and the Y-axis refers to PI. Cell status is analyzed in four quadrants, and annexin V+/PI+ double-positive cells are presented in the upper-right quadrant. (B) Flow cytometry assay of U251 cells after invasion by EGDe. (C) Flow cytometry assay of U251 cells after invasion by DPI-treated EGDe. (D) Flow cytometry assay of U251 cells after invasion by NAC-treated EGDe. (E) Statistical analysis of cells in each quadrant of the cytometry assay. (F) Statistical data of annexin V+/PI+ positive cells. Student t-test was used for statistical analysis, *P < 0.05, **P < 0.01.
