
Fig 3. KRIT1 regulates steady-state levels of intracellular ROS.
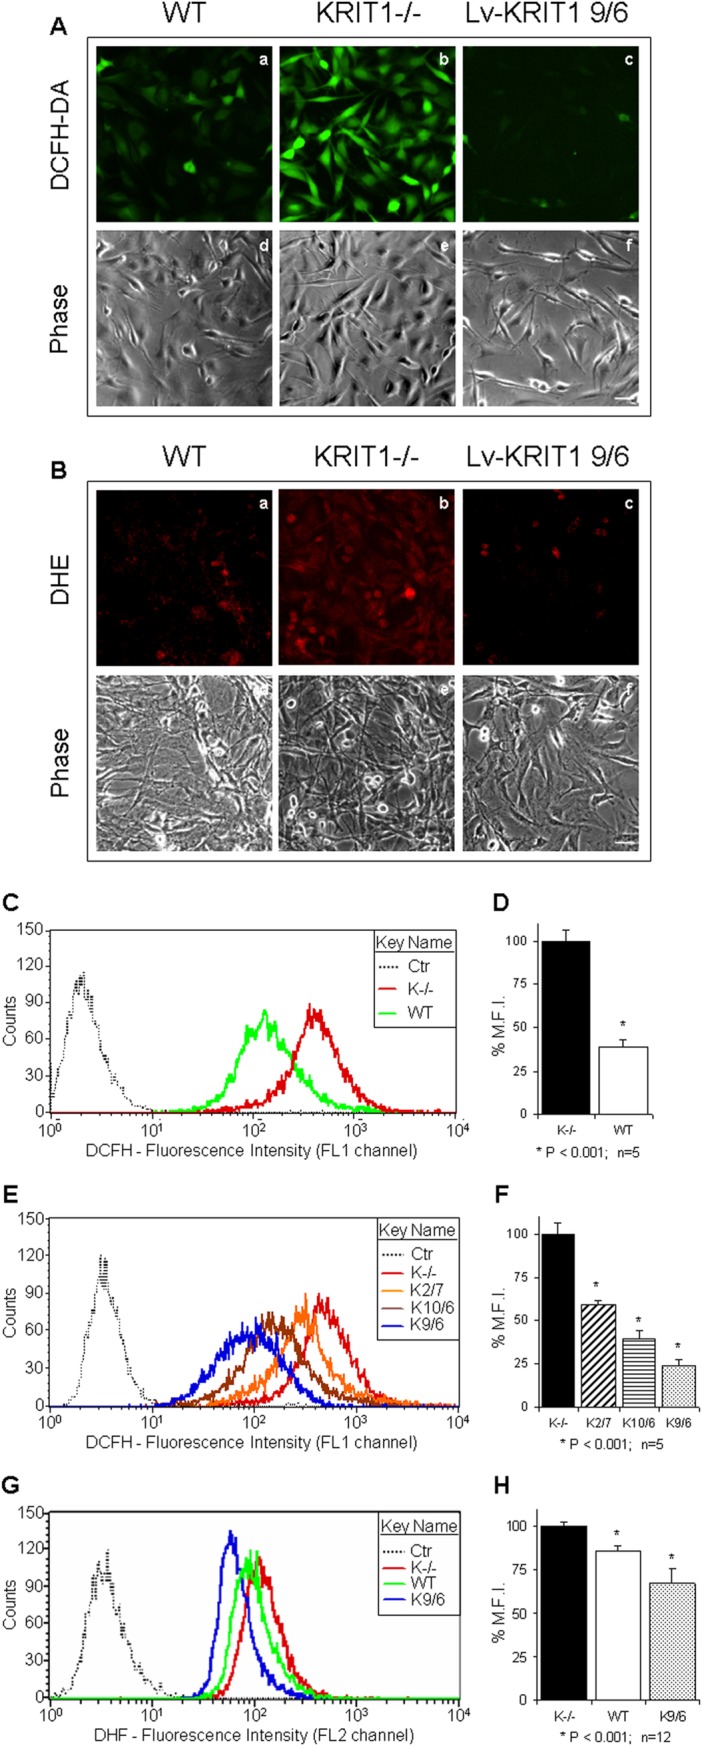
A–B) Qualitative detection of the steady-state levels of intracellular ROS by fluorescence microscopy. Wild-type (WT), KRIT1−/− (KRIT1−/−) and KRIT1-transduced (Lv-KRIT1 9/6) MEFs grown under standard conditions were analyzed by fluorescence microscopy 20 min after the addition of the cell-permeable redox-sensitive fluorogenic probe DCFH-DA (A) or DHE (B). The images were taken with a fixed short exposure time and a high fluorescence intensity threshold value to avoid saturation, and are representative of several independent experiments. Notice that KRIT1−/− cells (panels b) showed significantly more intense fluorescent signals than WT cells (panels a), indicating that they contained higher levels of ROS. Conversely, ROS levels in KRIT1−/− cells were reduced to near WT levels upon KRIT1 re-expression by lentiviral infection (panels c). Scale bar represents 50 μm. C–H. Quantitative determination of the steady-state levels of intracellular ROS by FACS analysis. Wild-type (WT), KRIT1−/− (K−/−) and three distinct KRIT1−/− cell populations re-expressing KRIT1 at low, medium and high levels, respectively [Lv-KRIT1 2/7 (K2/7), 10/6 (K10/6) and 9/6 (K9/6)], were grown under standard conditions and analyzed by FACS 20 min after the addition of the DCFH-DA (C–F) or DHE (G,H) probes. Representative flow cytometry profiles (C,E,G) and quantitative histograms of the mean fluorescence intensity (M.F.I.) values (D,F,H) of n≥5 independent FACS experiments are shown. M.F.I. values were normalized to spontaneous fluorescence of control cells untreated with the fluorogenic probes (Ctr) and expressed as percentage of KRIT1−/− (K−/−) cells (± SD). *P<0.001 versus KRIT1−/− cells. Notice that KRIT1−/− cells displayed the highest content of intracellular ROS, whereas the re-expression of KRIT1 caused a significant, expression level-dependent decrease in intracellular ROS levels.