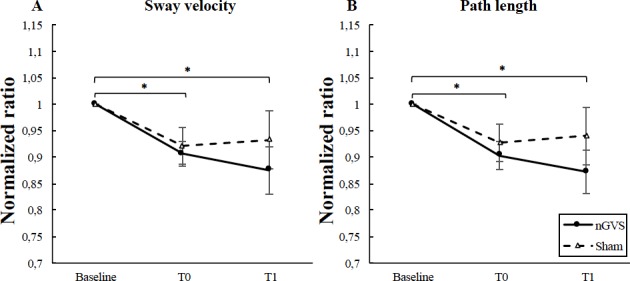
Fig 1.

(A) Sway velocity and (B) path length in nGVS group and sham group at each time point (Baseline; T0; T1). Results suggest a significant improvement of sway velocity and path length in both groups at T0 and T1. Error bars represent the standard error of the mean. * = p<0.0001.
