
Figure 2.
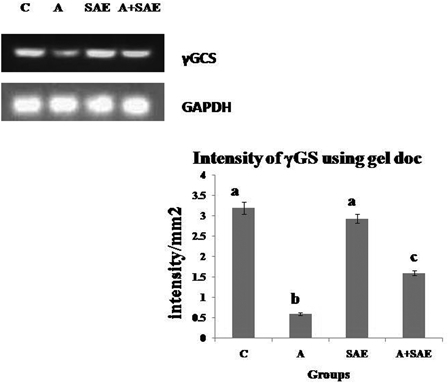
Intensity of γGCS mRNA using gel doc. The relative amount of γGCS mRNA was estimated by semi-quantitative RT-PCR. The PCR products were quantified by densitometry and standardized to their respective GAPDH controls. The mean intensity was measured and expressed as intensity/mm2. Results are expressed as average of quadriplicate experiments ± SD. Different letters indicate values statistically significant at P < 0.05. The level of γGCS mRNA was decreased significantly in alcohol-treated rats compared to control rats and there was an increase in the level in co-administered group compared to alcohol-treated group.