
Figure 3.
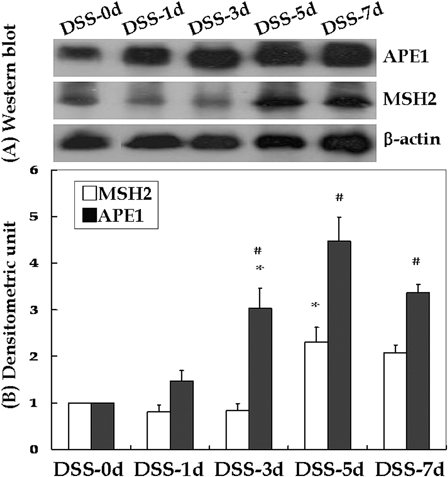
Western blotting and densitometry evaluations of young rats with DSS-induced colitis. Compared to the previous time point, APE1 and MSH2 levels were significantly higher at DSS-3d and DSS-5d, respectively (*P < 0.05). A significant difference was also noted between MSH2 and APE1 at the same time point (#P < 0.05); this resulted in significantly different curves (P < 0.01).