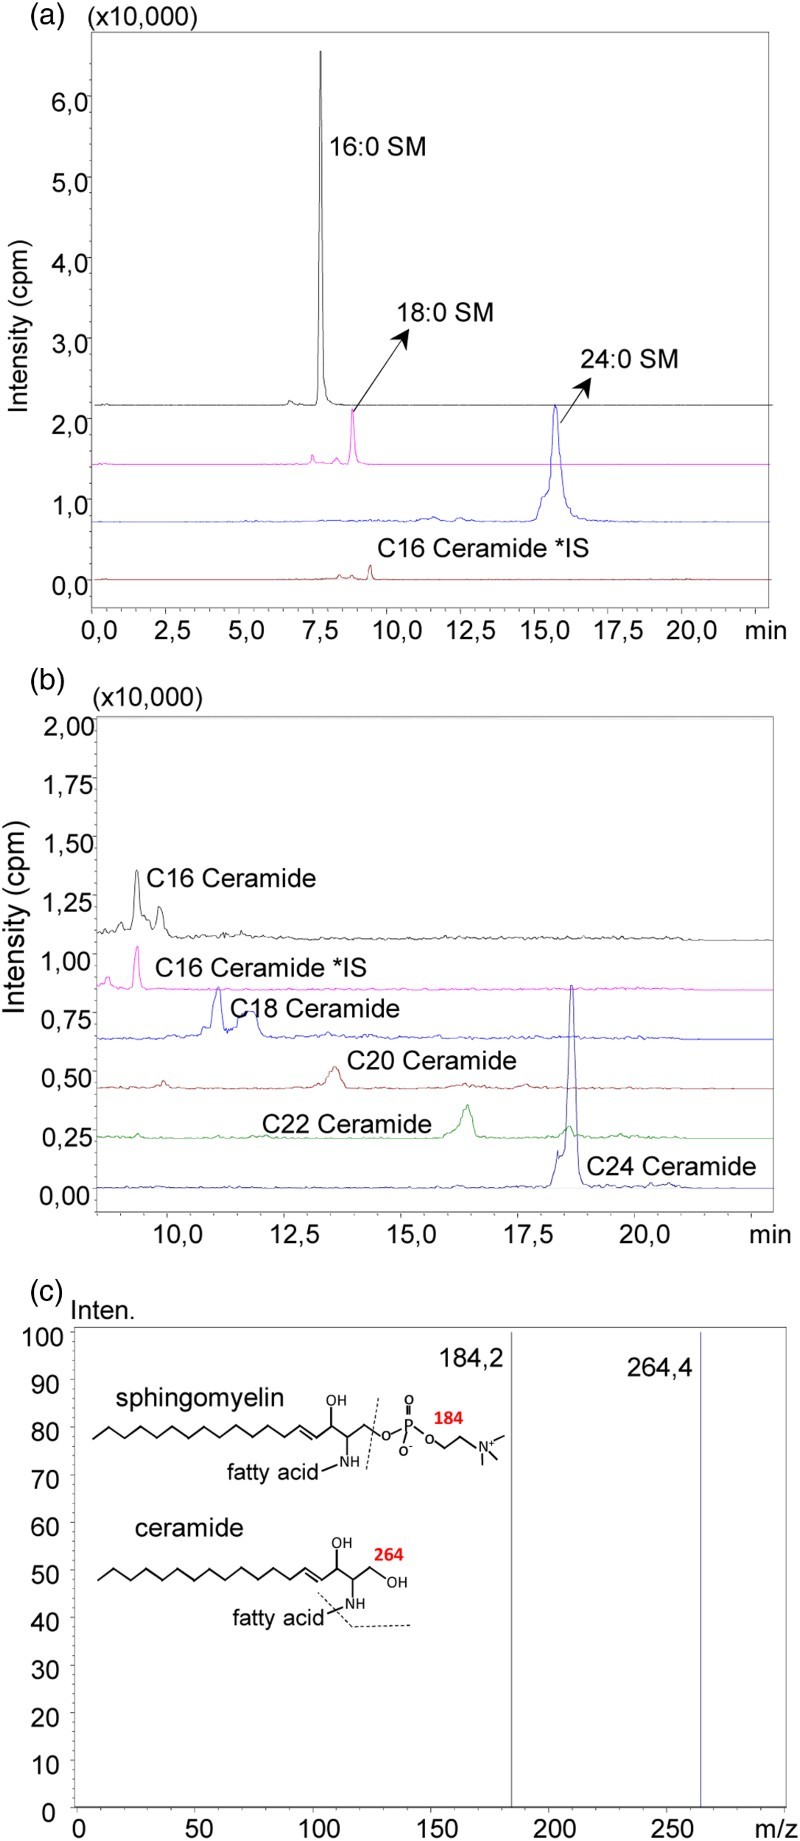
Figure 6.

(A) representative pozitif ion mode spectra of sphingomyelins (SM) and ceramides measured in control liver tissue (A) Pozitif ion mode spectra of C16, C18 and C24 SM. (B) Mass spectra of C16, C18, C20, C22 and C24 ceramide. (C) Tandem mass spectra of the analyzed sphingolipids
