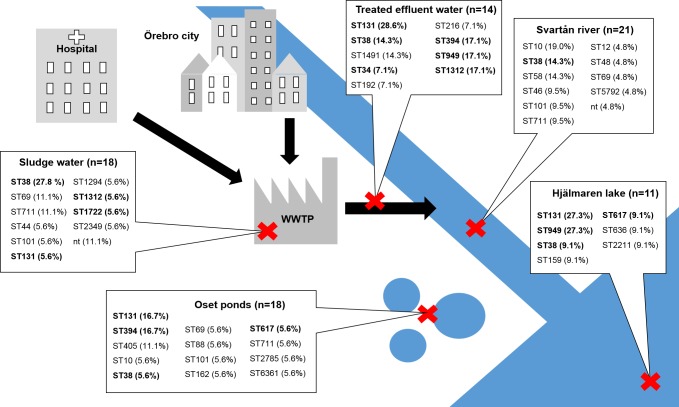
Fig 1. Schematic map of the study area.
The red crosses indicate the sampling locations at the wastewater treatment plant (WWTP) and in Svartån River, Hjälmaren Lake, and Oset ponds. Six water samples were collected from each sampling site (three in June and three in October). Presented in the figure are also the number of isolates included from each site and the sequence types (ST) found in the respective locations., STs in bold were also found among the clinical isolates.

