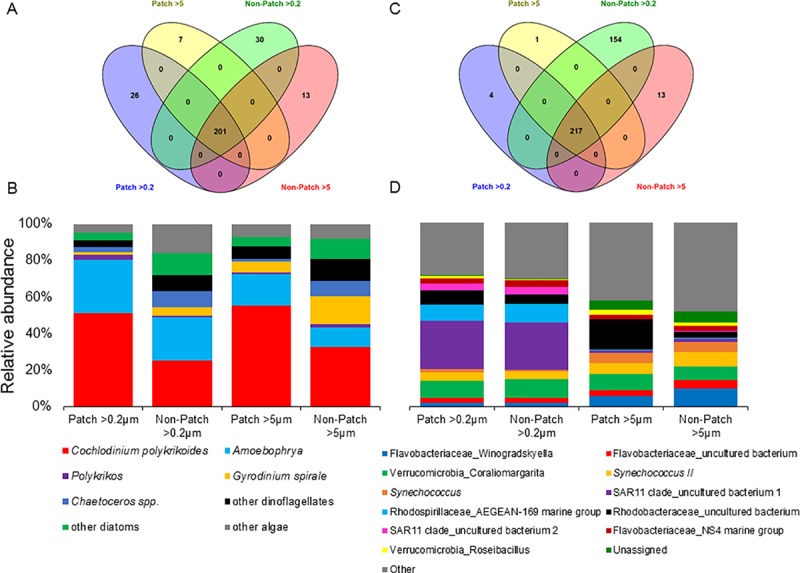
Fig 3.

Venn diagrams demonstrating the shared and unique A) 18S OTUs-, C) 16S OTUs- and average abundances of corresponding B) 18S consensus lineages- and D) 16S consensus lineages- of the core microbiomes found among Patch >0.2 and >5, and Non-patch >0.2 and >5 micron size fractioned samples. Venn diagrams colors represent the following: patch >0.2 (blue), patch >5 (yellow), non-patch >0.2 (green) and non-patch >5 (red). Numbers within the diagrams represent number of OTUs.
