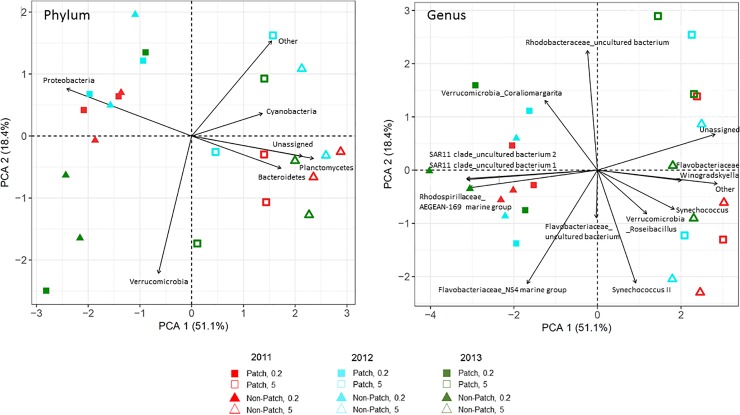
Fig 4. Principal component analyses using Phylum- and genus/species- level Hellinger transformed relative abundances of bacterial sequences from size fractionated (>0.2 and >5 micron) samples collected within and immediately adjacent (<10m) to the Cochlodinium bloom patches, designated ‘patch’ (P) and ‘non-patch’ (NP) samples, respectively, for years 2011, 2012 and 2013.
Percent variation explained by each principal component is indicated in parentheses.

