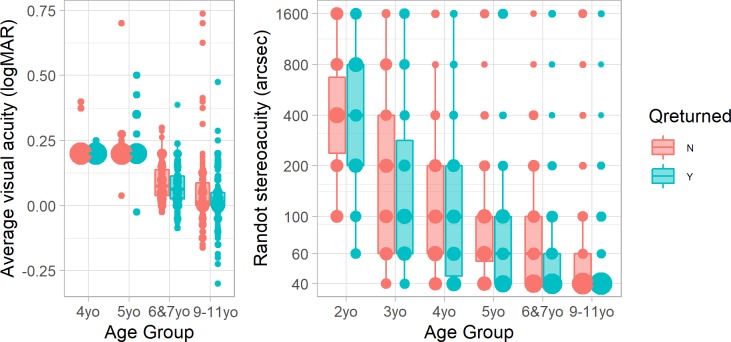
Fig 2.
(A) Visual acuity (average of left and right eyes) and (B) stereoacuity, by age-group, for children for whom a questionnaire was (blue, right) or was not (red, left) returned. Size of symbols show proportion obtaining the given score; Tukey box and whisker plots show interquartile ranges. Note that most children aged under 6 only underwent a screening acuity test, on which the best score was 0.2 logMAR.

