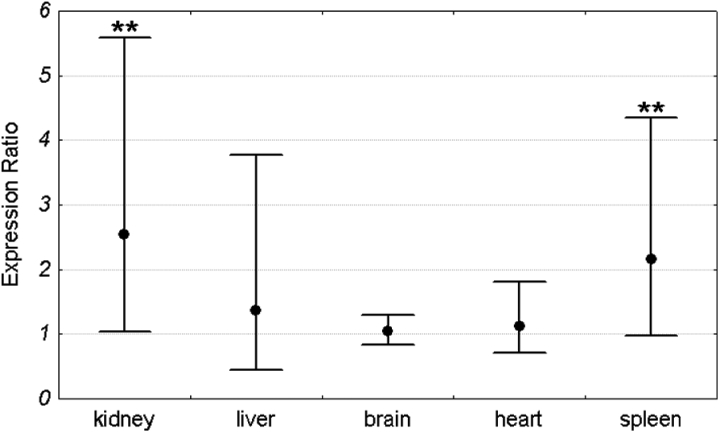
Figure 2.
Pir expression ratio in each organ of Sod1−/− mice relative to wild-type animals. Dots represent mean expression ratios (fold changes) over the Sod1+/+ and error bars represent standard errors. Asterisks denote the statistical significance of the difference between Sod1−/− and Sod1+/+ (pair-wise fixed reallocation randomization test; **P < 0.01). n = 16 animals (8 males and 8 females) with each genotype.

