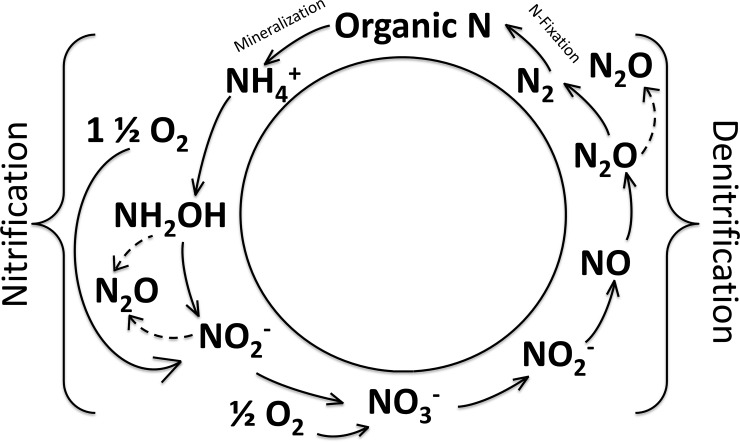
Fig 1. Schematic of the nitrogen cycle, featuring the microbial processes of nitrification (NH4+ to NO2– and then to NO3–) and denitrification (NO3– to NO2–, nitric oxide, N2O then to nitrogen gas).
For every mole of NH4+ nitrified to NO3–, two moles of oxygen are consumed (Stoichiometric relationships collectively found in [5,6,10–13]). Note that the proportion of N2O released from nitrification and denitrification is highly variable as indicated by the dashed arrows [14]. Nitrogen assimilation, dissimilatory NO3– reduction to NH4+ (DNRA) and anaerobic NH4+ oxidation (anammox) are excluded from the figure but may be important components of the nitrogen cycle [15].

