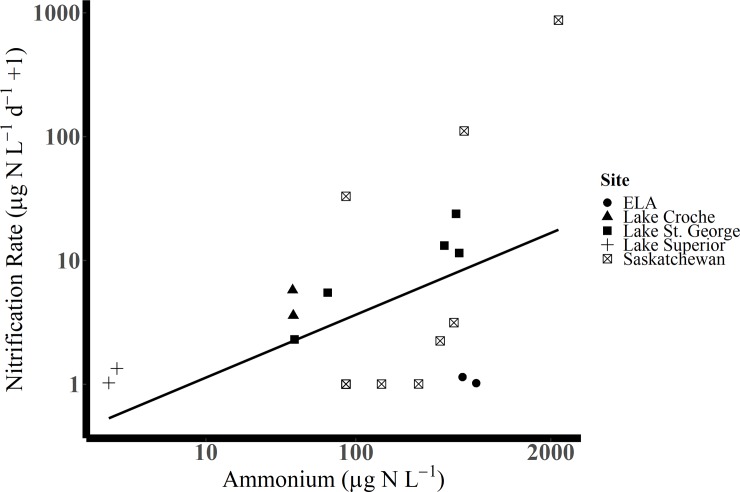
Fig 3. Relationship between nitrification rates and NH4+ concentrations for water bodies from this study (ELA and Saskatchewan) and other cold water measurements from Lake Superior (no ice-cover; [40]), Lake St. George (ice-covered; [21]) and Lake Croche (ice-covered; [38]).
Note logged y-axis. The line plotted is the linear model (permutations) for all data from Tables 1 and 2. The linear model and statistics are presented in Table 3. Nitrification rates less than their sample specific LOQ are replaced by their LOQ.

