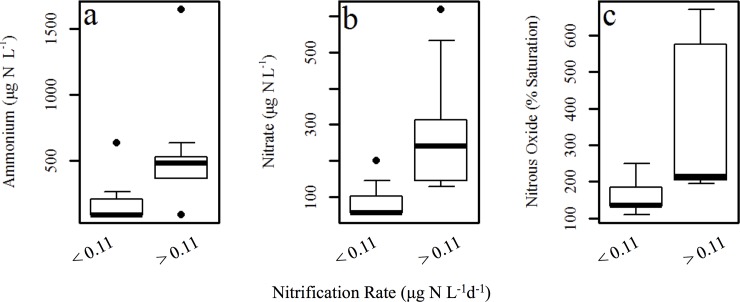
Fig 4. Concentrations of NH4+ and NO3–, and N2O percent saturation partitioned according to nitrification rates that are above or below 0.11 μg N L-1 d-1.
There are significant differences between the two rate groups for all analyses (NH4+, NO3–, and N2O; Wilcox-Mann-Whitney test, P <0.05). The boxplot and whiskers encompass 95% of the data observed, data points outside of the box and whiskers are outliers. The box itself represents the first and third quartiles, and the center line is the median [65].

