
Fig 5. Principal component analysis showing the relationship between measured variables and nitrification rates.
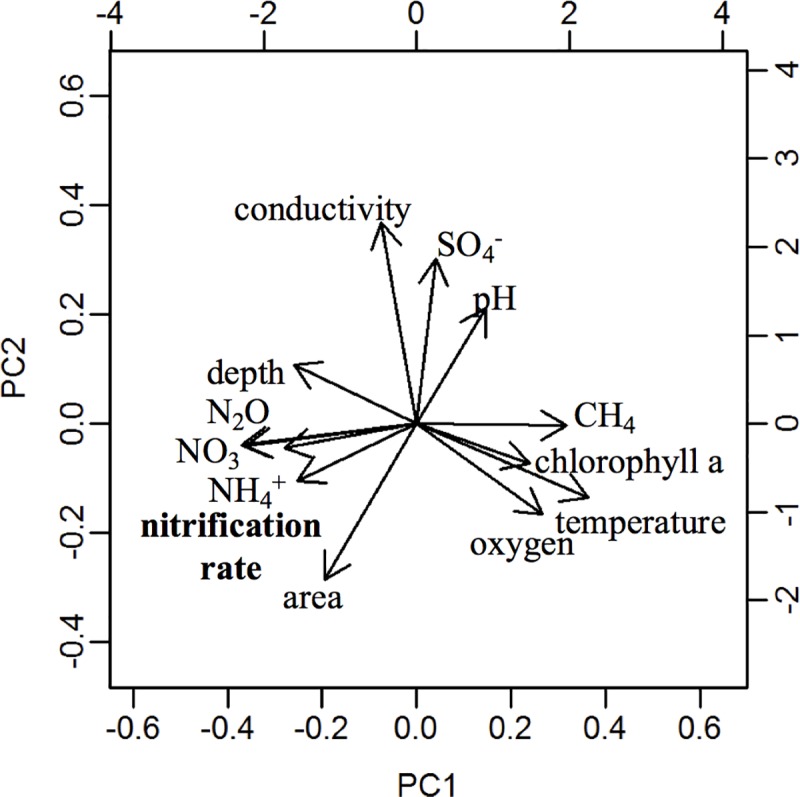
PC1 and PC2 account for 61% of the variance exhibited by the relationship among these variables. Within a PCA, the closer the component vectors are (angle and length) the more closely they are related. Note the association of nitrification rates with NO3–, N2O and NH4+, and of CH4 with chlorophyll and temperature.