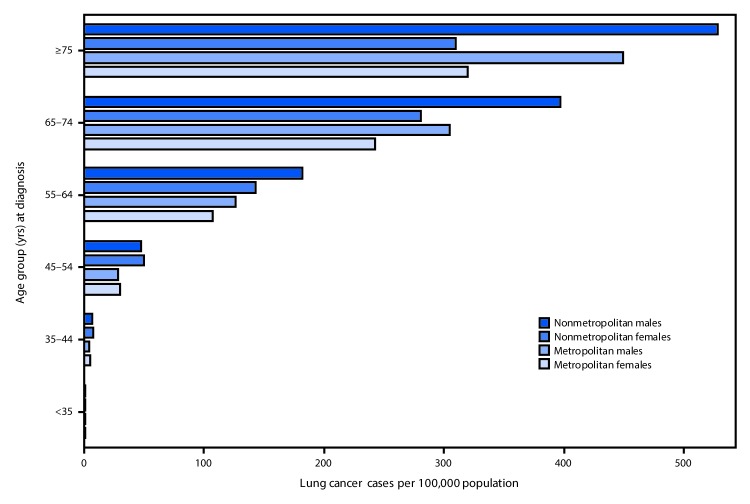
FIGURE 2.
Rate* of lung cancer in nonmetropolitan and metropolitan counties,† by sex and age at diagnosis — United States,§ 2016
* Per 100,000 persons and age-adjusted to the 2000 U.S. standard population.
† The U.S. Department of Agriculture Economic Research Service 2013 vintage rural-urban continuum codes were used to categorize county residence at time of cancer diagnosis as nonmetropolitan (codes 4–9) or metropolitan (codes 1–3). https://www.ers.usda.gov/data-products/rural-urban-continuum-codes.
§ Cancer incidence data were compiled from 49 cancer registries that meet the data quality criteria for all invasive cancer sites combined, representing approximately 97% of the U.S. population. (County-level data were not available for Kansas and Minnesota.)

