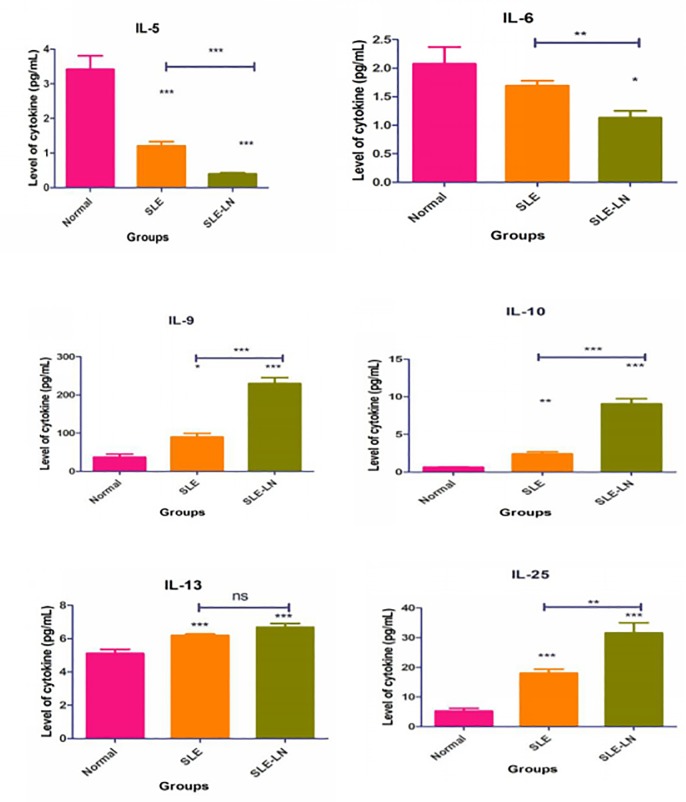
Fig 3. Mean expression levels of IL5, IL6, IL-9, IL-10, IL-13, and IL-25 in SLE and SLE-LN groups, as compared to the control group.
Error bar indicates the comparison of the cytokine expression between the SLE without LN and SLE with LN groups. Kruskal-Wallis test, followed by Duncan analysis, were used to compare the differential expression of cytokines between the groups. Results were expressed as mean ± SEM. * indicates p < 0.05, **indicates p < 0.01, and ***indicates p < 0.001).

