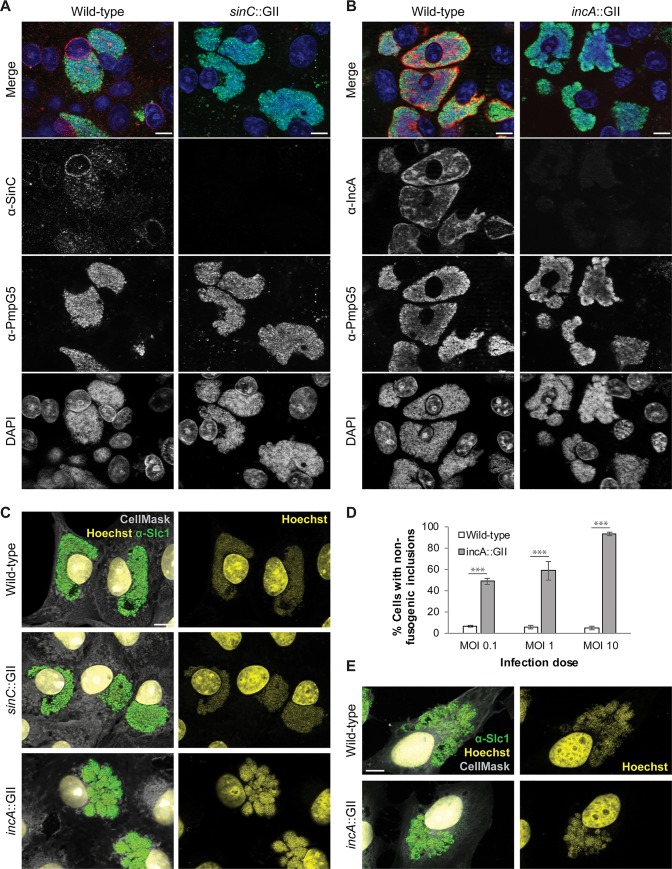
Fig 2. The C. caviae mutant incA::GII forms non-fusogenic inclusions in Vero cells.
(A-B) Fluorescence microscopic verification of the absence of SinC (A) and IncA (B) in Vero cells infected with respective C. caviae mutants (MOI 1). Shown are representative micrographs of cells that were fixed and stained at approximately 36 hpi (IncA (red), SinC (red), PmpG5 (green), DAPI (blue); scale bars, 10 μm). (C) Visualization of inclusion morphologies in Vero cells infected with wild-type or mutant C. caviae strains at an elevated multiplicity of infection (MOI 5). Shown are representative micrographs of cells that were fixed and stained at approximately 24 hpi (Slc1 (green), Hoechst (yellow), HCS CellMask (white); scale bars, 10 μm). (D) Quantification of distinct inclusion morphologies observed in Vero cells infected with C. caviae incA::GII. Inclusion morphology in cells infected with indicated strains at indicated MOIs (36 hpi) was manually categorized into “fusogenic’ (≤ 3 inclusions) and “non-fusogenic” (> 3 inclusions). At least 100 cells were analyzed per group and replicate (mean ± SD, n = 3, two-way ANOVA with Sidak’s multiple comparisons test, *** P < 0.001). (E) Visualization of inclusion morphologies in HeLa cells infected with wild-type or mutant C. caviae strains (MOI 5). Shown are representative micrographs of cells that were fixed and stained at approximately 24 hpi (Slc1 (green), Hoechst (yellow), HCS CellMask (white); scale bars, 10 μm).

