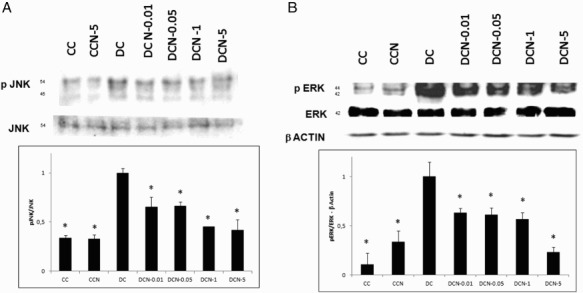
Figure 2.

Kinase phosphorylation in response to NAC treatment. Comparison of control cells (CC); Vehicle + NAC-treated cells (CCN); MDI cells (DC); MDI + NAC-treated cells (DCN-0.01: 0.01 mM NAC; DCN-0.05: 0.05 mM NAC; DCN-1: 1 mM NAC; DCN-5: 5 mM NAC). Values represent the fold decrease in protein expression compared with DC. Bars show the average of four different experiments (means ± SD). Representative results from one of independent western blot experiments with similar results are shown. The results are expressed as arbitrary units, *p < 0.01 CC, CCN or DCN vs. DC. (a) JNK½ phosphorylation. Results were normalized to JNK expression, (F = 59.32, degrees of freedom = 21). (b) ERK½ phosphorylation. The results were normalized to ERK and β-actin expression, (F = 39.40, degrees of freedom = 21).
